Aspnetcore: 2000ms delay serving any SPA files in development environment
Describe the bug
In the development environment, I'm seeing a 2000ms latency when serving any files from the SPA.
To Reproduce
Running Angular as a SPA in .net core 3.1 (new project).
 penfold
All 23 comments
@penfold thanks for contacting us.
That is probably normal and expected if the application is running in development, as React/Angular files need to be compiled by the dev-server.
@SteveSandersonMS do you have any further thought?
 javiercn
on 5 Dec 2019
javiercn
on 5 Dec 2019
@penfold can you please confirm that this delay happens only on the first request after modifying code or starting the server?
 mkArtakMSFT
on 5 Dec 2019
mkArtakMSFT
on 5 Dec 2019
@mkArtakMSFT It is for every file requested from the SPA via the development proxy process. It is for all file types including image resources.
Watching the debug output the typescript compilation is not the cause. I can see the expected extended response time for the first request during the building of the Angular project.
The API controller endpoints do not show the delay.
I'm just not sure how to start debugging this type of issue.
Thanks,
Paul
penfold
on 6 Dec 2019
I've run the SPA without using VS - just via 'ng s'. There is no delay when loading in this scenario. This is what is pointing me to Visual Studio 16.4 and the SPA Service Extensions (v3.1.0).
penfold
on 6 Dec 2019
@penfold Could you try and collect a trace with https://docs.microsoft.com/en-us/dotnet/core/diagnostics/dotnet-trace?
javiercn
on 6 Dec 2019
@javiercn Here is a trace. A number of downloads occur in time frame of the trace.
To me it looks like the delay is in unmanaged code - is this the interaction with Node?
Thanks,
Paul
penfold
on 9 Dec 2019
@penfold thanks for the trace.
I believe you are using application insights in your app during development and that seems to be where the app is spending most of the time?

Could you disable app insights and check if that solves the issue?
javiercn
on 10 Dec 2019
@javiercn I've removed AppInsights and set the logging for 'Microsoft' to none. This looks like it has removed a lot of noise in the tracing (see new trace). Still seeing the 2 second delays.
penfold
on 12 Dec 2019
I believe this new trace still shows app insights is enabled

javiercn
on 12 Dec 2019
Sorry, wrong trace file.
penfold
on 12 Dec 2019
From what I can tell, this is external (unmanaged code) code

Do you get a 2 second delay on the first request for the file or on every single one of them.
Could you also collect the logs alongside the server trace?
Can you also make sure to include the sever logs at debug level? See https://docs.microsoft.com/en-us/aspnet/core/fundamentals/logging/?view=aspnetcore-3.1#event-source-provider on how to do so.
javiercn
on 12 Dec 2019
I'm not totally sure what I'm doing here...
I've added the following:
    public static IWebHostBuilder CreateWebHostBuilder(string[] args) =>
            WebHost.CreateDefaultBuilder(args)
                .ConfigureLogging((hostingContext, logging) =>
                {
                    logging.AddFilter("XXXXX", LogLevel.Debug);
                    logging.AddEventSourceLogger();
                })
                .UseStartup<Startup>();
    }
I'm not sure that to put as XXXX for 'server logs'?
Also, do I need to specify a provider on the trace commandline?
penfold
on 12 Dec 2019
It is every file...

penfold
on 12 Dec 2019
 public static IWebHostBuilder CreateWebHostBuilder(string[] args) =>
            WebHost.CreateDefaultBuilder(args)
                .ConfigureLogging((hostingContext, logging) =>
                {
                    logging.AddFilter("XXXXX", LogLevel.Debug);
                    logging.AddEventSourceLogger();
                })
                .UseStartup<Startup>();
    }
It seems like you are using the old webhost instead of the new generic host. I thought we were looking at an out of the box application, am I wrong here? Could you check with a brand new 3.1 app and see if it happens there? That way we can look what's different.
The event source logger should be enabled by default in the out of the box templates (it's enabled by default on the webhost).
You need to pass --providers Microsoft-Extensions-Logging to capture the logs in the trace
javiercn
on 12 Dec 2019
I've updated my project to use the generic host build - it still shows the same issue.
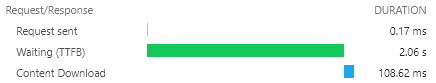
I have created a vanilla .net core 3.1 SPA and retested. This shows the issue. Here are the logs:
This is the browser network details:

Could this be down to something external that is affecting file access?
penfold
on 12 Dec 2019
I've looked at the new trace.
I'm not sure if we are capturing the Debug logs, but I can't see any logging related to the SPA apps. I'm not sure how to dig deeper into this. I'll ask a couple of folks.
@SteveSandersonMS do we have any logging on SPAs?
@davidfowl Is there a better way to do an investigation than the trace from dotnet trace?
javiercn
on 12 Dec 2019
@javiercn Nothing specific. The proxying code is at https://github.com/aspnet/AspNetCore/blob/master/src/Middleware/SpaServices.Extensions/src/Proxying/SpaProxy.cs.
 SteveSandersonMS
on 12 Dec 2019
SteveSandersonMS
on 12 Dec 2019
Just to add, I'm having crazy delays with the proxy too...
Especially with a bigger app that I've just converted from AngularJS to Angular 9.
Often the .NET proxy server will just throw a timeout, while I can instantly access the Angular server by just visiting the port that it was launched on.
 cpboyd
on 13 Dec 2019
cpboyd
on 13 Dec 2019
I just noticed that my vendor.js is 8.3MB in development.
Is there perhaps some issue with the proxy limiting transfers?
I know that Kestrel on Linux had some limitation in place.
cpboyd
on 13 Dec 2019
I created #17925 regarding error messaging... But some tips from stuff I've listed there:
Try ng serve from the client app folder to actually get the error message.
.NET never lists errors related to node_modules (maybe @angular reports those differently).
Compilation errors will appear in the .NET command prompt, but they still result in a generic "timeout" exception from .NET's HTTP response.
cpboyd
on 23 Dec 2019
It looks like https://github.com/aspnet/AspNetCore/issues/18062 may be related.
penfold
on 2 Jan 2020
We've moved this issue to the Backlog milestone. This means that it is not going to be worked on for the coming release. We will reassess the backlog following the current release and consider this item at that time. To learn more about our issue management process and to have better expectation regarding different types of issues you can read our Triage Process.
mkArtakMSFT
on 9 Jun 2020
A temporary fix when running into this is to change the start script of the package.json of the app under development to:
"start": "ng serve --host ::1",
this will force the ng server to listen on the IPV6 localhost address and allow fast access. #18062 will also be solved by this workaround.
This might cause some side effects when moving to machines which only have ipv4 or use a different resolve order.
It seems impossible to start ng serve with two listening addresses (ipv4 and ipv6)
YMMV
 keesspoelstra
on 11 Jul 2020
keesspoelstra
on 11 Jul 2020
Related issues
 githubgitgit
·
3Comments
githubgitgit
·
3Comments
 ipinak
·
3Comments
ipinak
·
3Comments
 bgribaudo
·
3Comments
bgribaudo
·
3Comments
 farhadibehnam
·
3Comments
farhadibehnam
·
3Comments
 ermithun
·
3Comments
ermithun
·
3Comments
Most helpful comment
It looks like https://github.com/aspnet/AspNetCore/issues/18062 may be related.