Aspnetcore: AspNet Core 2.2.7 memory leak on alpine 3.9 docker image
Describe the bug
We recently updated our aspnet core application to use the mcr.microsoft.com/dotnet/core/aspnet:2.2.7-alpine3.9 docker image. We let it soak on 2 separate staging & test environments and noted that both steadily consumed more and more memory.
We continued to monitor for several days expecting the memory usage to flatten out at some point, but it just kept growing.
I updated the docker image to use mcr.microsoft.com/dotnet/core/aspnet:2.2.7-alpine and the memory usage growth disappeared entirely.
The growing memory usage was observed regardless of traffic or load of the container, even an idle container has exhibited the pattern.
The growing memory usage was observed on both container metrics as well as the reported WorkingSetSize from the application itself. GC Memory remained stable, so the growth does not stem from managed objects.
To Reproduce
Steps to reproduce the behavior: ( I have not yet been able to test if any aspnet core project will exhibit this behavior or if it has to do with any of the code in our application )
- Using this docker image
mcr.microsoft.com/dotnet/core/aspnet:2.2.7-alpine3.9 - Wait roughly ~10 hours+
- Observe memory usage of the container instance over time.
Expected behavior
Memory usage should stabilize at a reasonable value and not continue to grow.
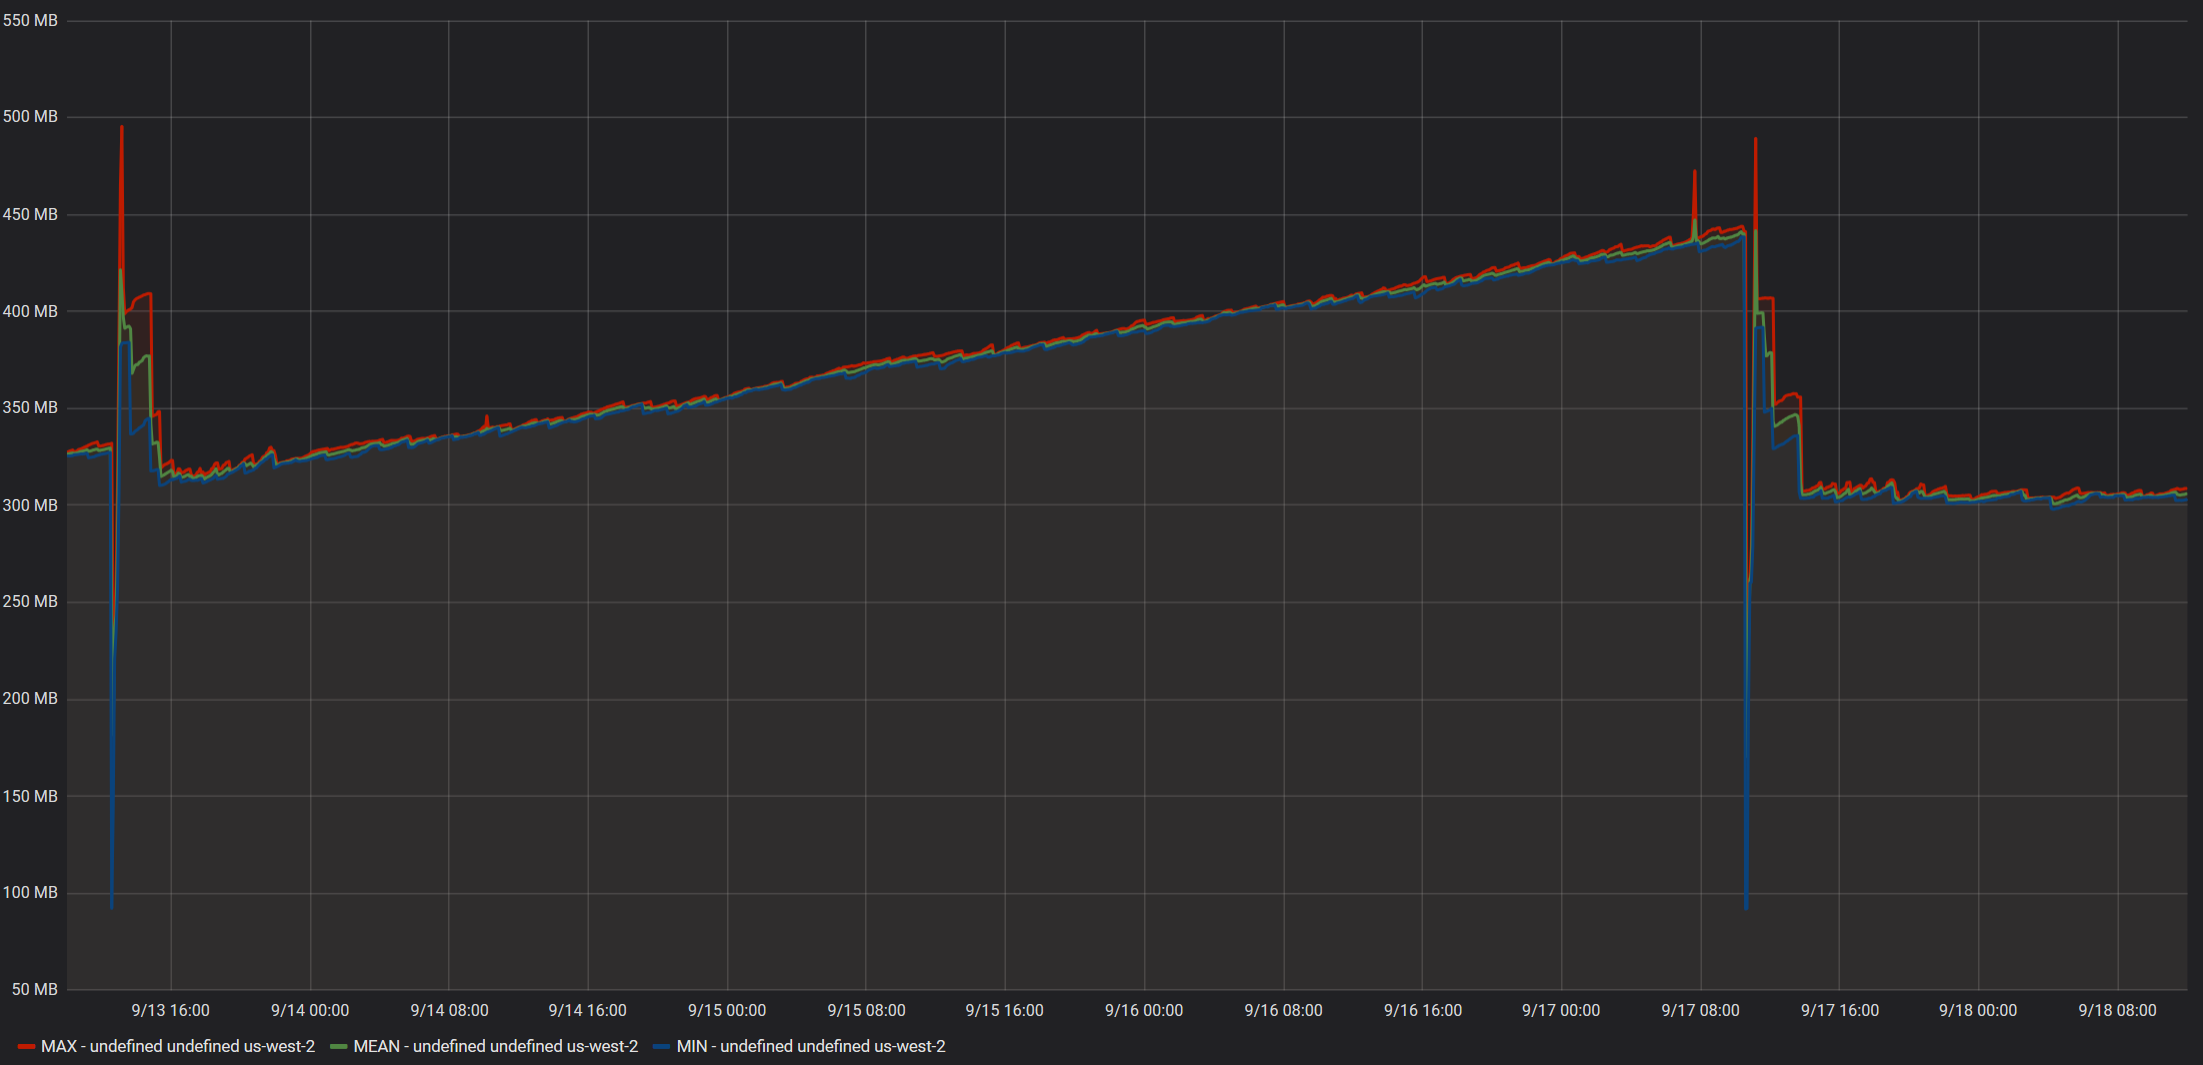
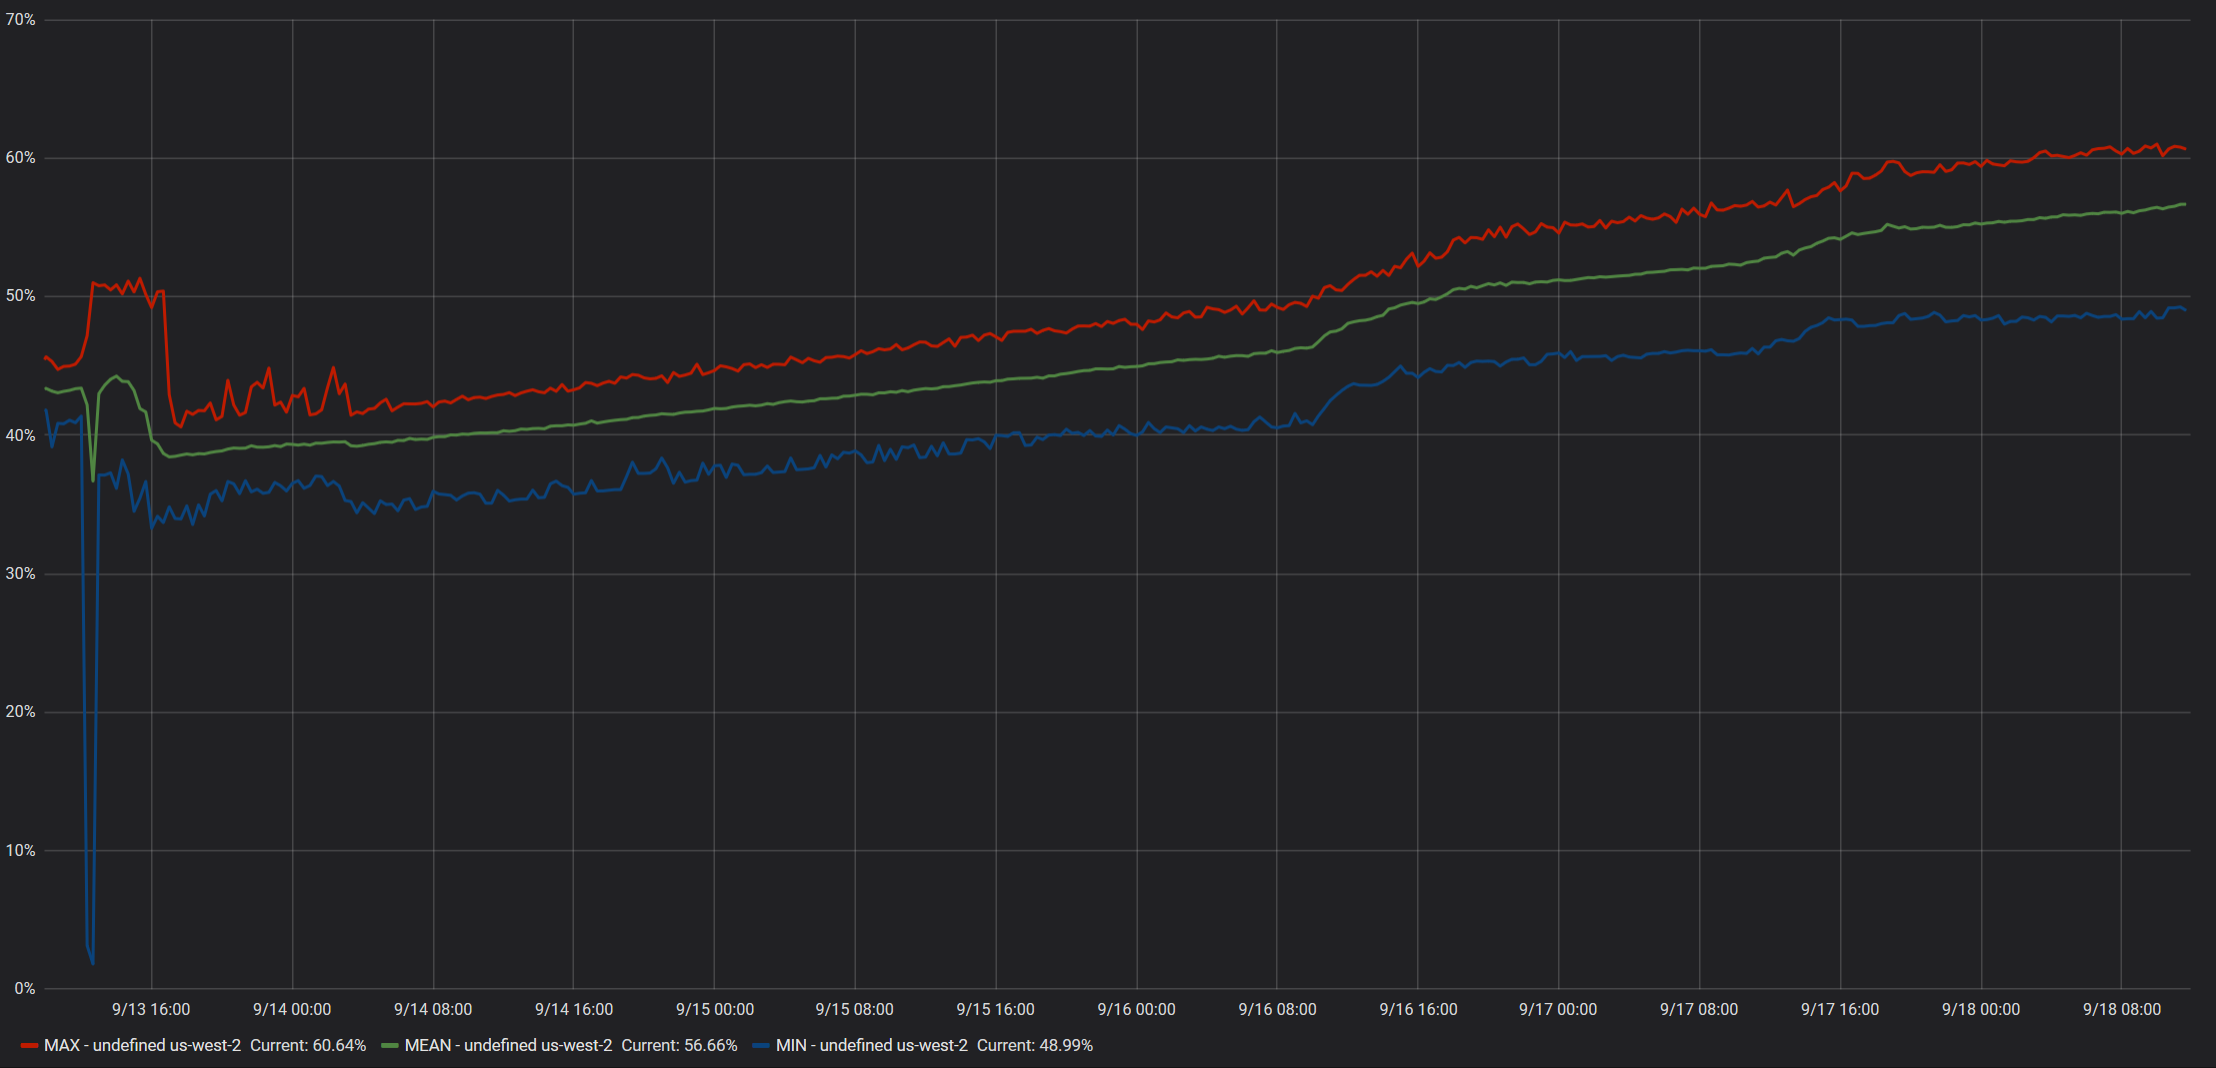
Screenshots from Idle Instance
Data reported by ECS Metrics:

Working set size reported by application:
GC Memory size reported by application:

The spike at 9/13 is when we deployed mcr.microsoft.com/dotnet/core/aspnet:2.2.7-alpine3.9
The spike at 9/17 is when we deployed mcr.microsoft.com/dotnet/core/aspnet:2.2.7-alpine
Screenshots from instance with moderate daytime load
Data reported by ECS Metrics:
Working set size reported by application:

GC Memory size reported by application:

The spike at 9/13 is when we deployed mcr.microsoft.com/dotnet/core/aspnet:2.2.7-alpine3.9
Additional context
- The docker containers are hosted on AWS EC2 Linux instances using ECS.
- No special configurations or flags are used, as in we are not setting a specific GC mode or anything of that nature.
- The containers have a defined hard memory limit set, but no CPU Units or Ulimits.
 Bio2hazard
All 17 comments
/cc @sebastienros
 pranavkm
on 19 Sep 2019
pranavkm
on 19 Sep 2019
@Bio2hazard what leads you to believe this is a memory leak in ASP.NET Core? Can you share a memory profile/dump?
 anurse
on 25 Sep 2019
anurse
on 25 Sep 2019
Hi @anurse ,
I do not know if the memory leak is specifically in ASP.NET Core, or stems from corefx or coreclr. I filed the ticket here because the memory growth was observed specifically with the mcr.microsoft.com/dotnet/core/aspnet:2.2.7-alpine3.9 docker image.
Getting a memory dump will be a bit challenging, since our environments mirror our production environment, and as such do not have any dev tools installed. However, I will see what I can do.
Bio2hazard
on 25 Sep 2019
Thanks @Bio2hazard ! Without more information here we don't have much to go on. As far as I know, we're not aware of any framework/platform memory leaks specific to that image, so we'd need to have quite a bit more detail to investigate further.
Please note that, in general, we don't have the capacity to throughly investigate customer applications (Microsoft Support is better equipped for that), so without more data indicating that this is a memory leak in the platform, we can't commit to diagnosing this kind of issue. We're happy to help where can and provide some guidance to help track down the problem though! I just want to set expectations appropriately :).
anurse
on 25 Sep 2019
Hi @anurse ,
I understand your position, but I can not think of any defect on our end / in the customer application that would work fine on the mcr.microsoft.com/dotnet/core/aspnet:2.2.7-alpine image, but leak memory on the mcr.microsoft.com/dotnet/core/aspnet:2.2.7-alpine3.9 docker image.
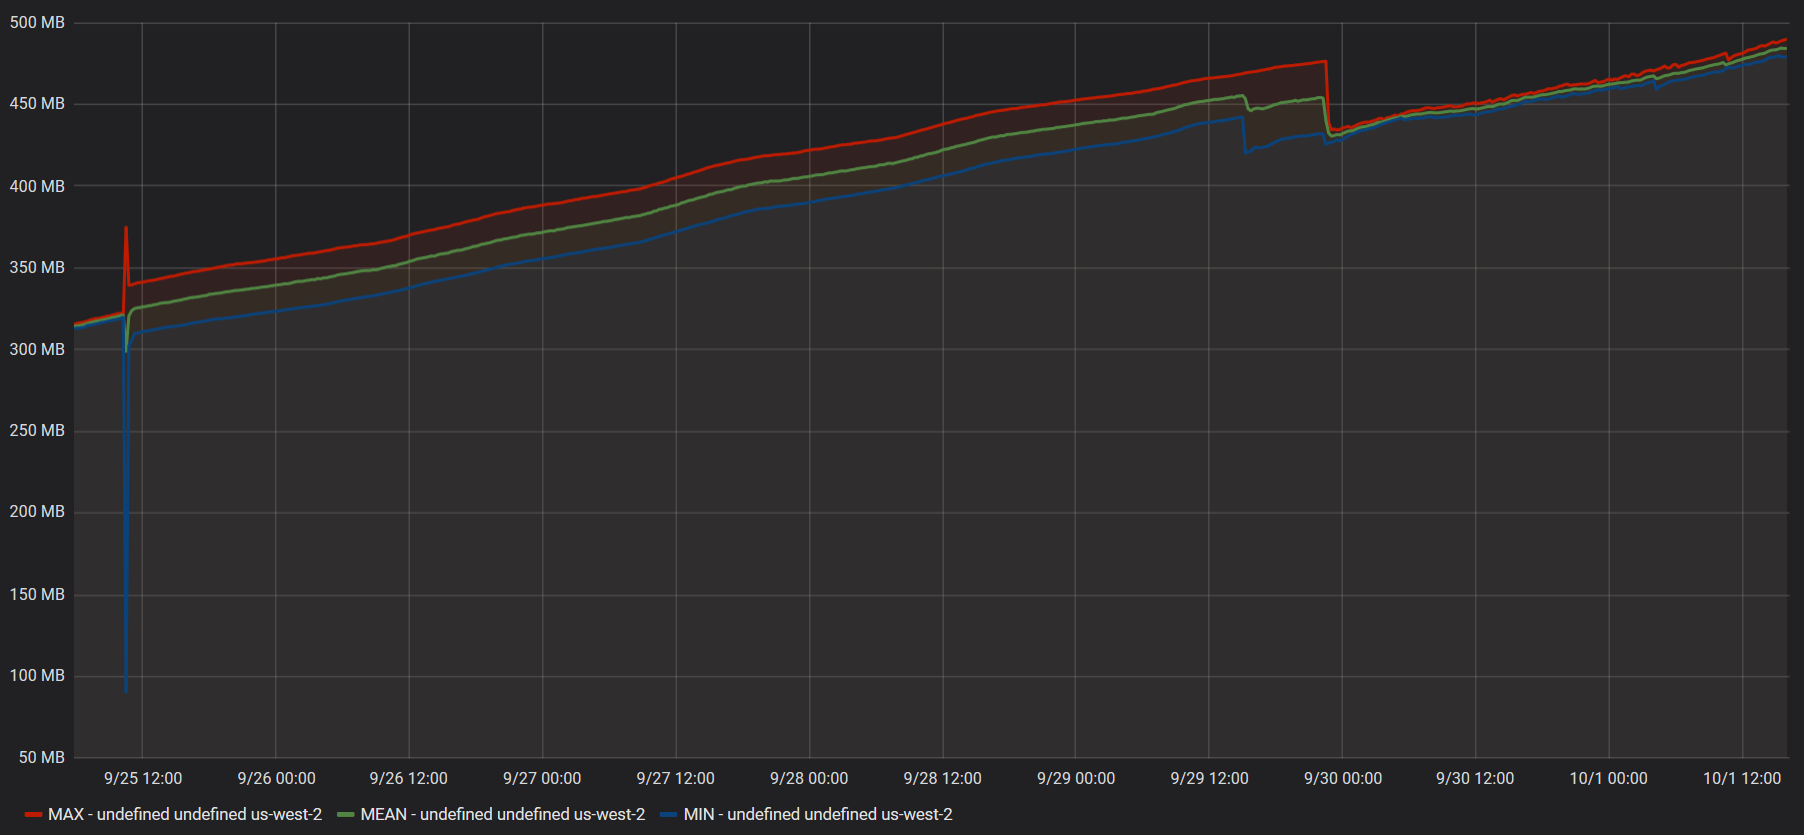
To validate that this is an issue with the image, I deployed our service again on the -alpine3.9 image and observed memory growth:
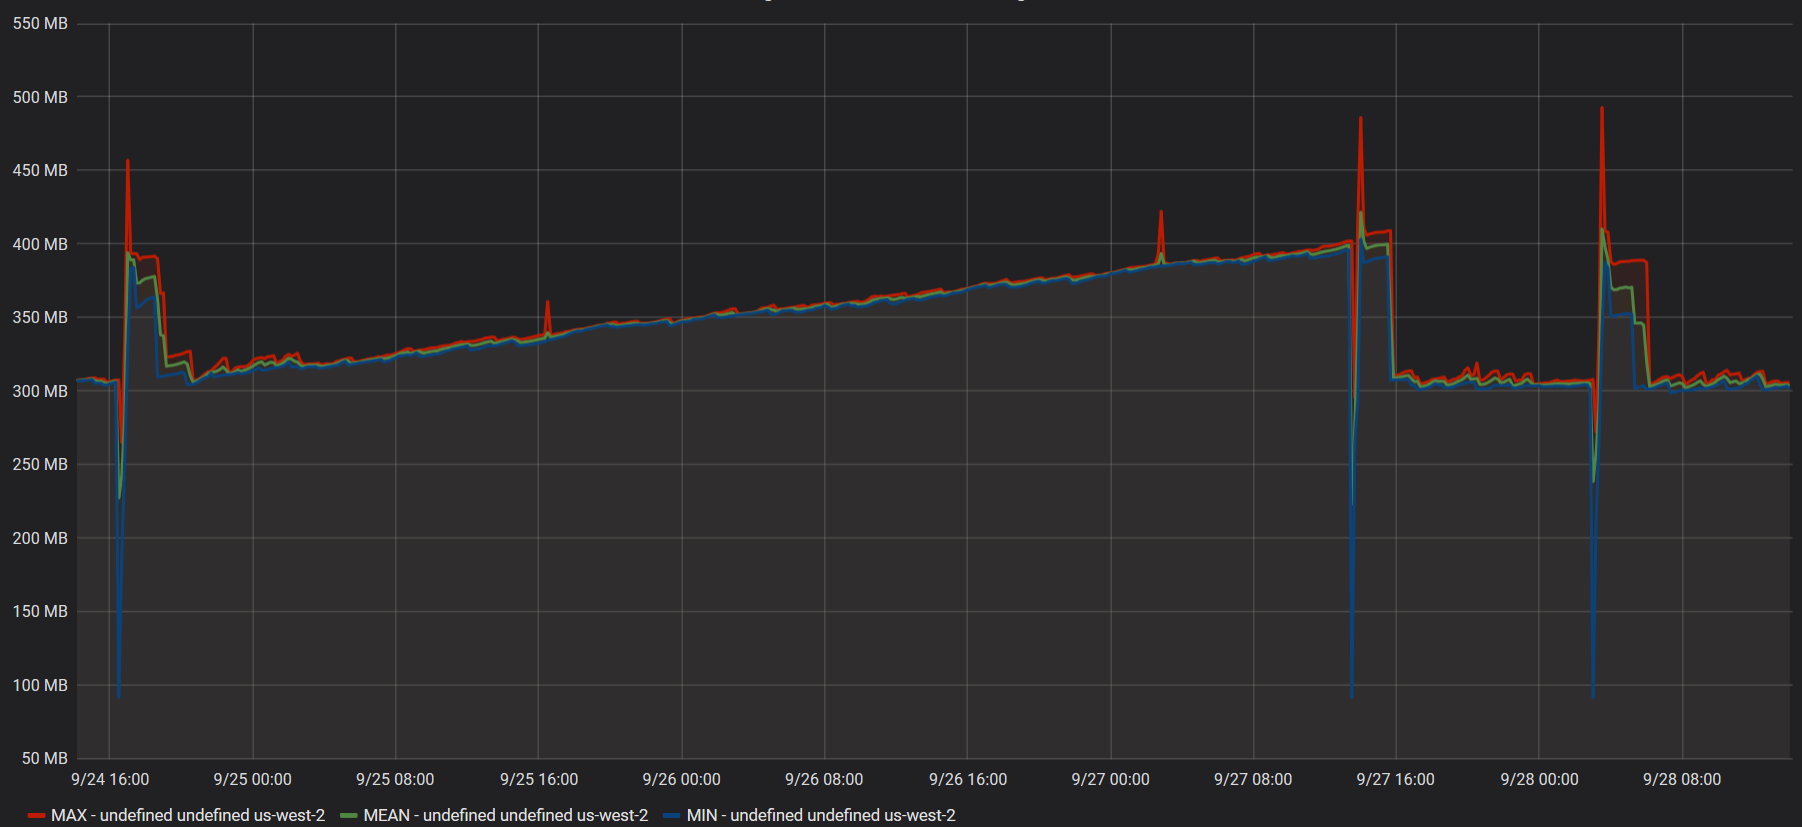
Same story, showing the working set growth with -alpine3.9 and then the steady working set with the -alpine image.
I also deployed 2 additional microservices ( with different application code ) with -alpine3.9:
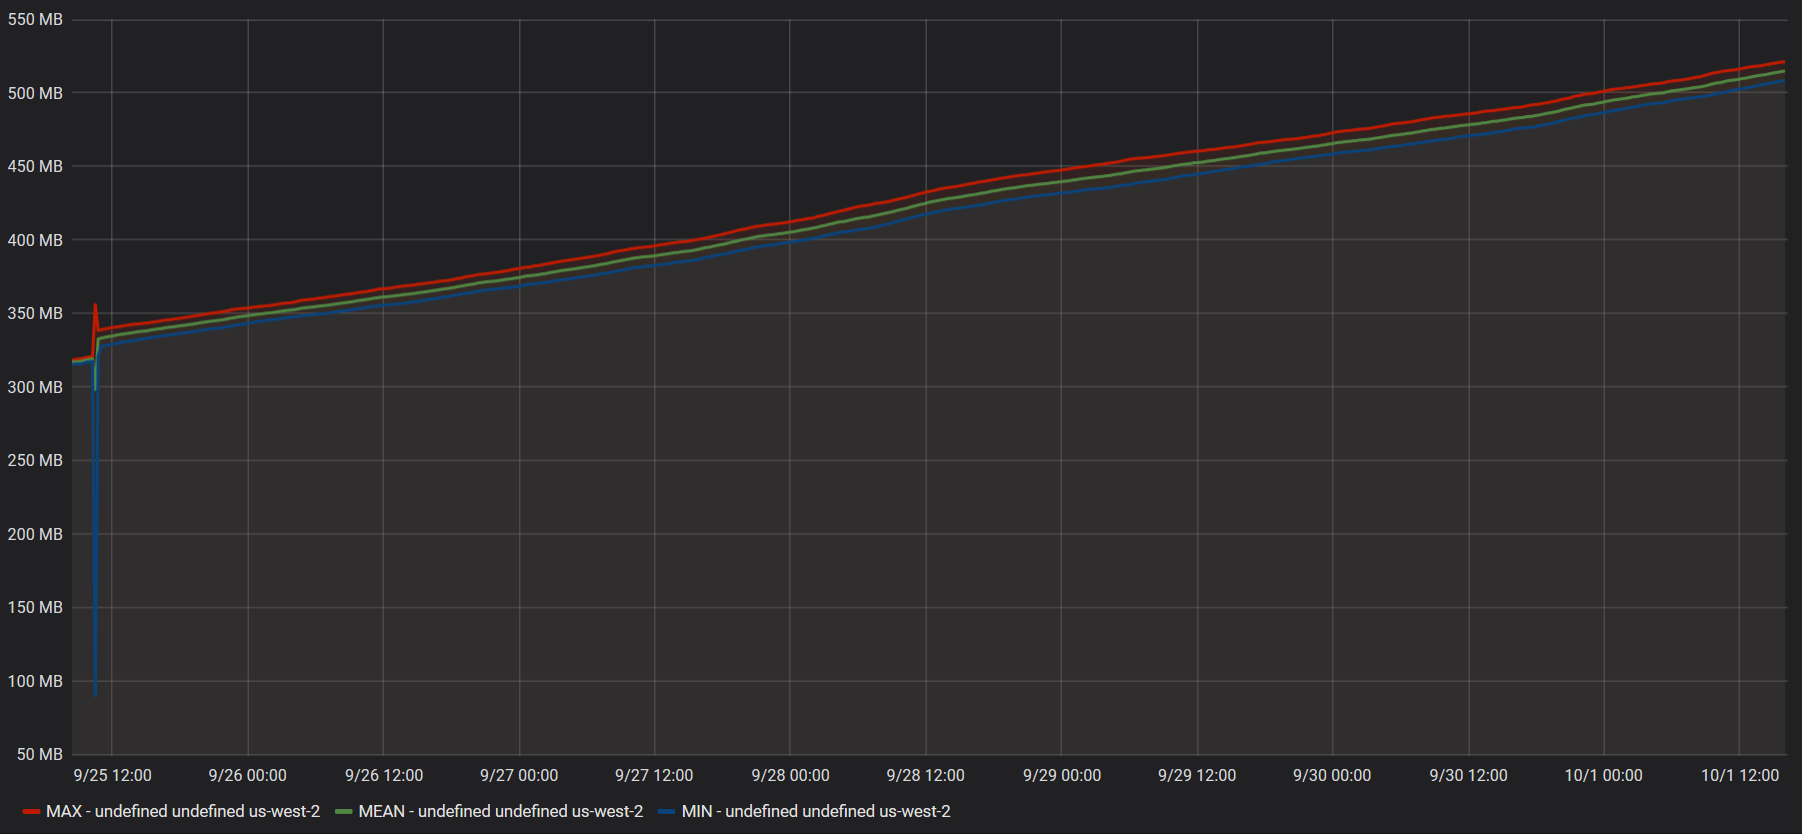
As you can see, they also exhibit this problem.
All 3 services have a BackgroundService implementation that polls files on S3. I deployed one service with a shorter interval to see if the rate at which the memory grows corresponds with the frequency of S3 requests, but I was unable to find a correlation.
I'm still trying some things out and will report back if I can find anything that influences the rate at which memory grows, but it would be very helpful if you could deploy a mcr.microsoft.com/dotnet/core/aspnet:2.2.7-alpine3.9 imaged container on your end and run tests against it.
Bio2hazard
on 2 Oct 2019
I'm still trying some things out and will report back if I can find anything that influences the rate at which memory grows, but it would be very helpful if you could deploy a
mcr.microsoft.com/dotnet/core/aspnet:2.2.7-alpine3.9imaged container on your end and run tests against it.
We have tests that run on a variety of platforms and they don't currently indicate any platform-specific issues. We're always evaluating exactly which platforms we test on but that has to be prioritized against all the other work we have in front of us. It really doesn't matter what our apps show in the lab for diagnosing this issue though, we need to know what's happening with this app.
The most important thing when diagnosing an issue like this is to do some memory profiling to find out which objects are taking up all this extra space. Without that we don't have anything to go on.
anurse
on 2 Oct 2019
Hello @anurse ,
I was able to run one of our containers locally and reproduce the issue.
Since it runs on alpine, lldb does not work ( https://github.com/dotnet/diagnostics/blob/master/documentation/lldb/linux-instructions.md#alpine-36 ), however I was able to use the dotnet-dump tool ( https://github.com/dotnet/diagnostics/blob/master/documentation/dotnet-dump-instructions.md ) to create a full core dump.
I can open the dump using dotnet-dump analyze, but it seems it can only be used to check managed resources, not native ones. So I am a bit stuck on how I can get meaningful information about the growing working set size.
Attempts to debug the dump on windows has failed as no tool I have is capable of opening it ( I have tried the new WinDbg preview, PerfView and VS2019 ).
Please advise how I can get information from the dump that will aid your debugging efforts.
Bio2hazard
on 7 Oct 2019
You are correct that the dotnet dump analyze command is for managed memory only. If there's no managed objects taking up significant space, then this is likely to be a runtime issue which is beyond my expertise. Do you know for sure that the managed memory isn't the cause of the leak?
For analyzing native memory, I believe you'd need to use lldb, either by finding one that works on Alpine or by taking the dump to a different machine. It appears that the lldb included in Alpine 3.9 may work: https://github.com/joe-elliott/netcore-kubernetes-profiling/issues/4#issuecomment-502326934
It might be worth taking this to a forum like https://github.com/dotnet/core since we don't have much expertise in debugging native memory issues like this. It's certainly possible that there's some kind of interaction between the managed runtime and a native component that changed in Alpine 3.9 which is causing a native leak like this, but we don't have much experience there. If you have memory dumps you can share, there are likely people on that forum that could help better than we could.
anurse
on 8 Oct 2019
Thank you for the guidance, @anurse .
I tried to move the dump to my host windows system but was unable to debug it.
I might have a lead though. So far I took a snapshot 2 days ago and one yesterday, and when comparing dumpheap I noticed that "Free" - which I believe is space reclaimed by the GC but not released to the OS ( and please correct me if I am wrong ). So I think it might be an issue where the application chooses to allocate more rather than re-using reclaimed space, and not releasing the reclaimed space back to the OS.
I will take a third snapshot today and verify if Free has continued to grow. I will report back shortly.
Here is some data from the dump:
dumpheap 10/6/2019:
00007f5b7a16e950     2114       395824 System.Object[]
00007f5b7a189660     8952       429696 System.Text.StringBuilder
00007f5b7a18ef70     4950       514800 System.Reflection.RuntimeMethodInfo
00007f5b7d538128     8366       535424 System.Text.RegularExpressions.RegexNode
00007f5b7a175e70    10647      1058760 System.Int32[]
00007f5b7a148ba0    10414      3547526 System.Char[]
00007f5b7a1583a0     5776      3939040 System.SByte[]
00007f5b7a188a68    51798      4190570 System.String
0000560feeddc9e0     4326      5751492      Free
00007f5b7a178cb8    10643      8010632 System.Byte[]
Total 306200 objects
dumpheap 10/7/2019:
00007f5b7d56fb28     3221       257680 System.Collections.Generic.Dictionary`2[[System.String, System.Private.CoreLib],[ThirdParty.Json.LitJson.JsonData, AWSSDK.Core]]
00007f5b7d5669b0     4106       328480 ThirdParty.Json.LitJson.JsonData
00007f5b7a16e950     1255       337984 System.Object[]
00007f5b7a175e70     4744       475552 System.Int32[]
00007f5b7a18ef70     4962       516048 System.Reflection.RuntimeMethodInfo
00007f5b7a1583a0     1569      1079368 System.SByte[]
00007f5b7a148ba0     2824      1294736 System.Char[]
00007f5b7a188a68    25598      1968536 System.String
00007f5b7a178cb8     6061      4984582 System.Byte[]
0000560feeddc9e0     4136      8631206      Free
Total 157717 objects
eeheap 10/6/2019:
Total LoaderHeap size:   Size: 0xd91000 (14225408) bytes.
=======================================
Number of GC Heaps: 2
------------------------------
Heap 0 (0000560FEEE75B40)
generation 0 starts at 0x00007F595999FE58
generation 1 starts at 0x00007F59598E61B0
generation 2 starts at 0x00007F5959703000
ephemeral segment allocation context: none
         segment             begin         allocated              size
00007F5959702000  00007F5959703000  00007F595A2A0D50  0xb9dd50(12180816)
Large object heap starts at 0x00007F5B59703000
         segment             begin         allocated              size
00007F5B59702000  00007F5B59703000  00007F5B59A8B230  0x388230(3703344)
Heap Size:       Size: 0xf25f80 (15884160) bytes.
------------------------------
Heap 1 (0000560FEEE7D0E0)
generation 0 starts at 0x00007F5A59E43058
generation 1 starts at 0x00007F5A59DA3A60
generation 2 starts at 0x00007F5A59703000
ephemeral segment allocation context: none
         segment             begin         allocated              size
00007F5A59702000  00007F5A59703000  00007F5A5A8BE168  0x11bb168(18592104)
Large object heap starts at 0x00007F5B69703000
         segment             begin         allocated              size
00007F5B69702000  00007F5B69703000  00007F5B69CDAEB0  0x5d7eb0(6127280)
Heap Size:       Size: 0x1793018 (24719384) bytes.
------------------------------
GC Heap Size:    Size: 0x26b8f98 (40603544) bytes.
eeheap 10/7/2019:
Total LoaderHeap size:   Size: 0xd91000 (14225408) bytes.
=======================================
Number of GC Heaps: 2
------------------------------
Heap 0 (0000560FEEE75B40)
generation 0 starts at 0x00007F5959946290
generation 1 starts at 0x00007F59598E61B0
generation 2 starts at 0x00007F5959703000
ephemeral segment allocation context: none
         segment             begin         allocated              size
00007F5959702000  00007F5959703000  00007F5959B34570  0x431570(4396400)
Large object heap starts at 0x00007F5B59703000
         segment             begin         allocated              size
00007F5B59702000  00007F5B59703000  00007F5B59B4B380  0x448380(4490112)
Heap Size:       Size: 0x8798f0 (8886512) bytes.
------------------------------
Heap 1 (0000560FEEE7D0E0)
generation 0 starts at 0x00007F5A59E44960
generation 1 starts at 0x00007F5A59DA3A60
generation 2 starts at 0x00007F5A59703000
ephemeral segment allocation context: none
         segment             begin         allocated              size
00007F5A59702000  00007F5A59703000  00007F5A5A1A6F60  0xaa3f60(11157344)
Large object heap starts at 0x00007F5B69703000
         segment             begin         allocated              size
00007F5B69702000  00007F5B69703000  00007F5B69CDAEB0  0x5d7eb0(6127280)
Heap Size:       Size: 0x107be10 (17284624) bytes.
------------------------------
GC Heap Size:    Size: 0x18f5700 (26171136) bytes.
I tried installing lldb from the link you posted, but it does not seem to work. It does not seem to be able to find the lldb package:
bash-4.4# apk add lldb
fetch http://dl-cdn.alpinelinux.org/alpine/v3.9/main/x86_64/APKINDEX.tar.gz
fetch http://dl-cdn.alpinelinux.org/alpine/v3.9/community/x86_64/APKINDEX.tar.gz
ERROR: unsatisfiable constraints:
  lldb (missing):
    required by: world[lldb]
Unfortunately, the theory about Free does not seem to hold up with the third memory dump, taken today:
dumpheap 10/8/2019:
00007f5b7a189660     7574       363552 System.Text.StringBuilder
00007f5b7d538128     5918       378752 System.Text.RegularExpressions.RegexNode
00007f5b7a16e950     1926       382864 System.Object[]
00007f5b7a18ef70     4962       516048 System.Reflection.RuntimeMethodInfo
00007f5b7a175e70     8698       842860 System.Int32[]
00007f5b7a1583a0     4097      2803336 System.SByte[]
00007f5b7a148ba0     8909      3236124 System.Char[]
00007f5b7a188a68    43156      3843900 System.String
0000560feeddc9e0     4626      3902226      Free
00007f5b7a178cb8     9096     11160633 System.Byte[]
Total 259816 objects
eeheap 10/8/2019:
Total LoaderHeap size:   Size: 0xd91000 (14225408) bytes.
=======================================
Number of GC Heaps: 2
------------------------------
Heap 0 (0000560FEEE75B40)
generation 0 starts at 0x00007F59599AB078
generation 1 starts at 0x00007F59598FFF60
generation 2 starts at 0x00007F5959703000
ephemeral segment allocation context: none
         segment             begin         allocated              size
00007F5959702000  00007F5959703000  00007F5959E433B8  0x7403b8(7603128)
Large object heap starts at 0x00007F5B59703000
         segment             begin         allocated              size
00007F5B59702000  00007F5B59703000  00007F5B59B8B3F0  0x4883f0(4752368)
Heap Size:       Size: 0xbc87a8 (12355496) bytes.
------------------------------
Heap 1 (0000560FEEE7D0E0)
generation 0 starts at 0x00007F5A59F106E8
generation 1 starts at 0x00007F5A59DC8D98
generation 2 starts at 0x00007F5A59703000
ephemeral segment allocation context: none
         segment             begin         allocated              size
00007F5A59702000  00007F5A59703000  00007F5A5A98F818  0x128c818(19449880)
Large object heap starts at 0x00007F5B69703000
         segment             begin         allocated              size
00007F5B69702000  00007F5B69703000  00007F5B69CDAEB0  0x5d7eb0(6127280)
Heap Size:       Size: 0x18646c8 (25577160) bytes.
------------------------------
GC Heap Size:    Size: 0x242ce70 (37932656) bytes.
When I started the container on 10/3/2019, it reported GC Memory between 20 to 45 MB ( depending on when it last collected ), and reported a working set size of 135.4 MB.
Now, 5 days later, it is sitting at GC Memory between 20 to 45 MB ( unchanged as the application isn't doing anything other than healthchecks ), and is reporting a working set size of 334.5 MB.
I work for a large company so trying to share this memory dump ( which is 11 GB ) would have to go through a lot of red tape to get legal involved. I will see if I can come up with a minimal reproduction scenario.
Bio2hazard
on 8 Oct 2019
cc @davidfowl @halter73 to see if they have any thoughts
anurse
on 8 Oct 2019
We've also noticed a very similar issue when moving from 2.2.6-alpine3.8 to 3.0.0-alpine3.9. The process leaks unmanaged memory at a constant rate (regardless of load) while the managed heaps all stay very small and the GC is mostly idle. At first we thought it was upgrading to .NET Core 3.0, but it does appear to be related to the base image OS.
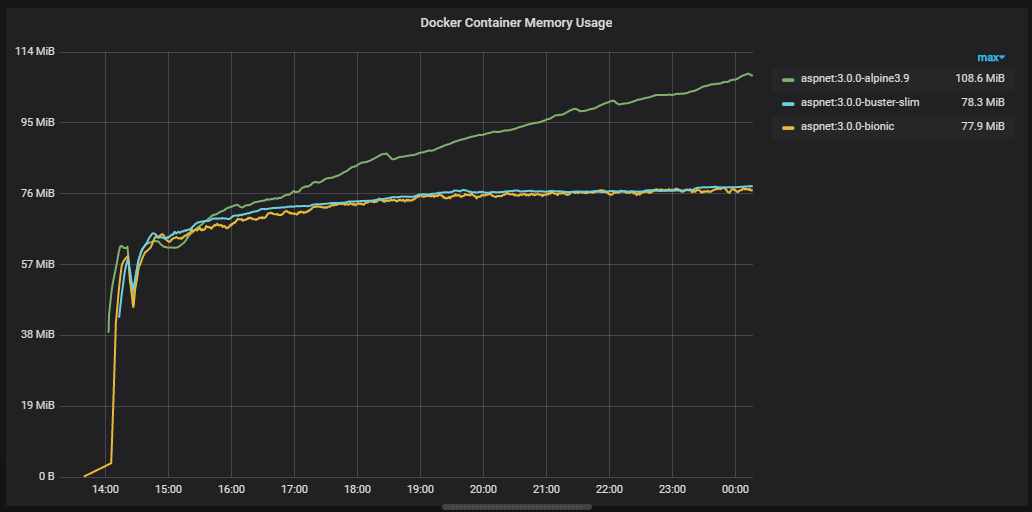
(averaged over 5 container instances per image, same DLLs copied to each image, 128Mb limit)
Here is a detailed look at an individual container instance over 26 hours, from start until it was OOM killed at 128Mb (the limit set on the container). The total heap size never exceeds 10Mb. Only 140 GC events occur over the 26 hours, with a few more gen 1 collections as the memory pressure increases above 90%:

We've failed to pin down the exact cause of the leak so far as most tools just give us information on the managed heap which has stable / reasonable object counts.
The issue occurs in both AWS ECS and Azure Kubernetes Service resulting in the container being OOM Killed. Confusingly, when using docker-compose locally the process will leak, but then stabilise at ~98% memory usage and never be killed.
The minimal repro we've been working on didn't leak until we added AWS SQS long polling. Not all of our leaking services use SQS so we're digging into that to work out what exactly in SQS polling might be triggering the leak - maybe outbound HTTPS requests?
Next, I'll be looking at building a 3.0.0-alpine3.8 image to see if the OS downgrade fixes the issue while keeping the same 3.0.0 runtime and also try out the recently released 3.1.0-preview1-alpine3.10.
While we work on a minimal repro, if anyone has any ideas on dumps we could run or other avenues of investigation, I'd be very grateful!
 gnjack
on 16 Oct 2019
gnjack
on 16 Oct 2019
Hi @gnjack ,
It's unfortunate that this issue is also affecting you, but I am also glad that it's not just me.
I have been working on a minimal repro myself, at first I tested just memory allocations, then I tested Console output ( since we log a decent amount of information to the console ), but neither of those yielded any results.
The next test I planned was outbound requests using HttpClient, and while it's too early to say with 100% confidence, I _think_ we have a winner!
@anurse Here is a solution that exhibits the the growing working set size:
Alpine39MemoryRepro.zip
After 4 hours of runtime:
Alpine 3.8's working set size remains between 98-101MB
Alpine 3.9's working set size started at ~98 MB, and is now at 107 MB.
GC Generations 0, 1 and 2 are all being collected and the managed memory has remained stable.
Usage for the repro:
- Navigate to the root of the extracted zip file
- Build 3.9 Image via:
docker build -t alpinememory -f .\Dockerfile-localtest . - (Optional) Build 3.8 Image via:
docker build -t alpinememory38 -f .\Dockerfile-localtest38 . - Run 3.9 Image via:
docker run -p 5001:8080 --name alpinememory -d alpinememory( alter host port if you wish ) - (Optional) Run 3.8 Image via:
docker run -p 5002:8080 --name alpinememory38 -d alpinememory38 - Wait at least 3 hours for trends to emerge
- Grab a report of working set size via
docker cp alpinememory:/tmp/report.csv ./report_39.csv - (Optional) Grab a report of alpine 3.8 for comparison via
docker cp alpinememory38:/tmp/report.csv ./report_38.csv
What the repro solution does:
- Relatively standard aspnet core 2.27 web api style project, with nginx reverse proxy.
- Starts 2 IHostedServices that inherit from
BackgroundWorker. Worker/ReportingWorker.csruns every minute and dumps memory-related information fromProcess.andGC.namespaces to a text file, and only exists to conveniently observe memory behavior over time without requiring any additional dependenciesWorker/WebRequestWorker.csruns every second and sends a HTTPS Get to one out of 16 pre-configured URLs. It then logs the number of A or a chars in the response, pretty sure that's unnecessary but I wanted to make sure the response content was used in some manner and nothing was optimized out.
- The URLs were chosen from the Alexa page ranks since I wanted to make sure to only send GETs to big, established sites. 1 request every 16 seconds probably does not bother them. 👍
- The requests are made using the recommended pattern of using
services.AddHttpClient();inStartup.cs, injectingIHttpClientFactoryand usingCreateClienton-demand.
Here are my results after 4 hours:
Alpine 3.9: report_39.txt
Alpine 3.8: report_38.txt
Bio2hazard
on 17 Oct 2019
the managed heaps all stay very small and the GC is mostly idle
GC Generations 0, 1 and 2 are all being collected and the managed memory has remained stable.
Sounds like this isn't really something in the scope of the ASP.NET Core team then. It think we'll need some deeper investigation from .NET Core folks here (cc @davidfowl @jkotas). Perhaps this issue should be moved to dotnet/core since it sounds like the problem runs much deeper than our stack.
anurse
on 17 Oct 2019
As an update to @gnjack's earlier comment:
We ran our repro app on 3.0.0-alpine3.8, 3.1.0-preview1-alpine3.10, and 3.0.0-alpine3.10 (from the nightly docker image) - and none of them exhibited the same memory leak we've seen on 3.0.0-alpine3.9!

So the good news is that even if we don't manage to diagnose the root cause of the leak, it looks like it can be avoided by sticking to alpine 3.8 for now, and rolling forward to the alpine 3.10 image (as soon as it's stable and released).
Even though we've been focusing on .net core 3, I would expect .net core 2.2 would have the same behaviour.
 GREsau
on 17 Oct 2019
GREsau
on 17 Oct 2019
Copied issue to https://github.com/dotnet/corefx/issues/41875 👍
Bio2hazard
on 17 Oct 2019
It looks like the corefx issue is getting a little more traction. I'll subscribe to it to make sure we follow along. For _now_ I'm going to close this one and if we get back to an ASP.NET Core issue we can revive it later.
anurse
on 18 Oct 2019
Related issues
 TanvirArjel
·
3Comments
TanvirArjel
·
3Comments
 UweKeim
·
3Comments
UweKeim
·
3Comments
 fayezmm
·
3Comments
fayezmm
·
3Comments
 bgribaudo
·
3Comments
bgribaudo
·
3Comments
 snebjorn
·
3Comments
snebjorn
·
3Comments
Most helpful comment
As an update to @gnjack's earlier comment:
We ran our repro app on
3.0.0-alpine3.8,3.1.0-preview1-alpine3.10, and3.0.0-alpine3.10(from the nightly docker image) - and none of them exhibited the same memory leak we've seen on3.0.0-alpine3.9!So the good news is that even if we don't manage to diagnose the root cause of the leak, it looks like it can be avoided by sticking to alpine 3.8 for now, and rolling forward to the alpine 3.10 image (as soon as it's stable and released).
Even though we've been focusing on .net core 3, I would expect .net core 2.2 would have the same behaviour.