Aspnetcore: Blazor - Configuration Must Be Provided to Debug
Describe the bug
dotnet run documentation states that it will default the configuration to Debug but requires configuration flag to be passed to debug Blazor, e.g., dotnet run -c Debug. I have not tested other dotnet projects, so it could be applicable to all of dotnet core.
To Reproduce
Steps to reproduce the behavior:
- Using this version of ASP.NET Core '3.0.100-preview7-012821'
- Run these commands
dotnet new blazordotnet run
- Open Chrome
- Load app at
http://localhost:5000 - Press
SHIFT+ALT+Dwith focus on the application Inspect>Consoletab.- See error
Cannot start debugging, because the application was not compiled with debugging enabled
Expected behavior
- The debugging tab should open, or in the case remote-debugging is not enabled, a tab should open with instructions on running Chrome with remote-debugging enabled (shows the
"%programfiles(x86)%\Google\Chrome\Application\chrome.exe" –remote-debugging-port=9222 http://localhost:5000/command).
Screenshots
Error:

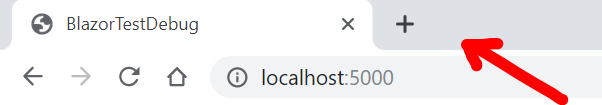
Tabs:
Additional context
Reported here based on suggestion from https://github.com/aspnet/AspNetCore.Docs/issues/13548
Track with https://github.com/aspnet/AspNetCore.Docs/pull/13594 for documentation updates based on decision from engineering
 djbreen7
All 9 comments
Commenting here so that I get an explicit ping from GH to revert the doc update when this is resolved.
 guardrex
on 1 Aug 2019
guardrex
on 1 Aug 2019
Thanks for contacting us, @djbreen7.
We are unable to reproduce this behavior with the given set of steps. Please provide any additional information which may help reproduce this.
 mkArtakMSFT
on 2 Aug 2019
mkArtakMSFT
on 2 Aug 2019
I was just able to repro it here again. For an unmodified template-based client-side Blazor app (dotnet new blazor) and running it in Chrome ...
dotnet run – Debugging doesn't fire up with Shift+Alt+D. The error is produced and the Chrome 'how to enable debugging' tab doesn't open.
dotnet run --configuration Debug (or -c Debug) – Works. No error message. The 'how to debug' tab opens in Chrome.
Chrome latest: Version 76.0.3809.87 (Official Build) (64-bit)
... and Pre7 SDK
guardrex
on 2 Aug 2019
Sure thing, @mkArtakMSFT !
Add
chrome.exeto path:

Download and install the dotnet-sdk-3.0.100-preview7-windows-x64-installer link
- Verify version:
dotnet --version

- Install Microsoft.AspNetCore.Blazor.Templates::3.0.0-preview7.19365.7:
dotnet new -i Microsoft.AspNetCore.Blazor.Templates::3.0.0-preview7.19365.7 - Create a new Blazor (client-side) application:
dotnet new blazor --name=MyBlazorApp cdinto MyBlazorApp
cd MyBlazorApp- Run the application with no flags:
dotnet run Open Chrome with remote debugging enabled
chrome.exe --remote-debugging-port=9222 http://localhost:5000/

Open Dev Tools and select Console
- Refocus on the application by clicking somewhere in the web content (the negative space below the "How is Blazor working for you?" text is perfect)
- Press
SHIFT+ALT+Dto start debugging
At this point, the error should be visible in the console:

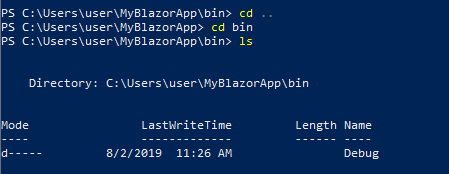
Note that
dotnet runimplicitly builds in Debug mode. This can be confirmed by the presence of a/bin/Debugfolder after runningdotnet run
Note that it works fine if the
-c Debug|--configuration Debugis explicitly

djbreen7
on 2 Aug 2019
Thanks @djbreen7.
We'll tackle this after we're done with the upcoming 3.0 release.
mkArtakMSFT
on 5 Aug 2019
Need instructions for Edge. Using:
"%programfiles(x86)%\Microsoft\Edge Beta\Application\msedge.exe" --remote-debugging-port=9222 http://localhost:2847/
instead of
"%programfiles(x86)%\Google\Chrome\Applicationchrome.exe" --remote-debugging-port=9222 http://localhost:2847/
doesn't. Edge still shows
"Could not get a list of browser tabs from http://localhost:9222/json. Ensure Chrome is running with debugging enabled."
Edge Version 78.0.276.11 (Official build) beta (64-bit)
 salavatov
on 1 Oct 2019
salavatov
on 1 Oct 2019
I have also reproduced this, it seems like the Debug configuration is not being applied as the environment is still Production.
Is there any updates here?
 eByte23
on 28 Dec 2019
eByte23
on 28 Dec 2019
FYI @eByte23 in case you don't get a quick answer. Many/most are OOF for the holidays ⛄️. It might take a few weeks to get a response.
guardrex
on 28 Dec 2019
This should be fixed in the 3.2-preview1 release.
 pranavkm
on 6 Jan 2020
pranavkm
on 6 Jan 2020
Related issues
 FourLeafClover
·
3Comments
FourLeafClover
·
3Comments
 ermithun
·
3Comments
ermithun
·
3Comments
 markrendle
·
3Comments
markrendle
·
3Comments
 BrennanConroy
·
3Comments
BrennanConroy
·
3Comments
 ipinak
·
3Comments
ipinak
·
3Comments