Aspnetcore: HTTP/2 connection error when proxying gRPC traffic through Envoy proxy
Describe the bug
I am seeing the following exception with a minimal gRPC project (greeter server/client) on the 105th request:
Microsoft.AspNetCore.Server.Kestrel.Core.Internal.Http2.Http2ConnectionErrorException: HTTP/2 connection error (PROTOCOL_ERROR): Pseudo-header field found in request headers after regular header fields.
   at Microsoft.AspNetCore.Server.Kestrel.Core.Internal.Http2.Http2Connection.ValidateHeader(Span`1 name, Span`1 value)
   at Microsoft.AspNetCore.Server.Kestrel.Core.Internal.Http2.Http2Connection.OnHeader(Span`1 name, Span`1 value)
   at Microsoft.AspNetCore.Server.Kestrel.Core.Internal.Http2.HPack.HPackDecoder.ProcessHeaderValue(IHttpHeadersHandler handler)
   at Microsoft.AspNetCore.Server.Kestrel.Core.Internal.Http2.HPack.HPackDecoder.OnByte(Byte b, IHttpHeadersHandler handler)
   at Microsoft.AspNetCore.Server.Kestrel.Core.Internal.Http2.HPack.HPackDecoder.Decode(ReadOnlySequence`1 data, Boolean endHeaders, IHttpHeadersHandler handler)
   at Microsoft.AspNetCore.Server.Kestrel.Core.Internal.Http2.Http2Connection.DecodeHeadersAsync(Boolean endHeaders, ReadOnlySequence`1 payload)
   at Microsoft.AspNetCore.Server.Kestrel.Core.Internal.Http2.Http2Connection.ProcessHeadersFrameAsync[TContext](IHttpApplication`1 application, ReadOnlySequence`1 payload)
   at Microsoft.AspNetCore.Server.Kestrel.Core.Internal.Http2.Http2Connection.ProcessFrameAsync[TContext](IHttpApplication`1 application, ReadOnlySequence`1 payload)
   at Microsoft.AspNetCore.Server.Kestrel.Core.Internal.Http2.Http2Connection.ProcessRequestsAsync[TContext](IHttpApplication`1 application)
Looking at the request that fails in wireshark, I do not see any pseudo-header's after the regular headers, so the exception appears to be incorrect.
To Reproduce
Steps to reproduce the behavior:
I've created a repo with code to reproduce the issue: https://github.com/coryflucas/dotnet-grpc-issue-repro. This contains a sample server, an example Envoy configuration, and a simple client program to call the server in a loop.
- Download reproduction repo
docker-compose up server envoy- this will build and start the server and envory containersdocker-compose up client- this will build and start the client container (note: this should start and then crash)
Expected behavior
The client should not crash after 105 requests.
Additional context
Configuring Envoy to only use the connection 100 times seems to alleviate the issue. Also tried using different gRPC methods to see if the magic number of 105 was tied somehow to the size/shape of the request and that doesn't seem to matter.
Here is the wireshark capture:
grpc.pcapng.gz. Let me know if I can provide any more information.
 coryflucas
All 11 comments
Probably not gRPC-specific so I'm re-targeting this. We have some ongoing work to look at improving some HTTP/2 protocol issues. cc @halter73
 anurse
on 15 Jul 2019
anurse
on 15 Jul 2019
@anurse @DAllanCarr I'm not convinced this is the same as the other Kestrel issues we've fixed so far, this error message is substantially different from those we've already fixed.
Something breaks between frames 481 and 491
 Tratcher
on 16 Jul 2019
Tratcher
on 16 Jul 2019
Yeah, I do agree, which is why I've left this one open. I think this is part of the fixes we need to make but may be a different thing.
anurse
on 16 Jul 2019
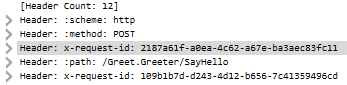
And there's a packet in the middle that Wireshark won't decode (487). It looks like an HTTP/2 header frame, but the value of that 3rd header (x41) looks wrong. It looks like it's trying to send a literal value https://tools.ietf.org/html/rfc7541#section-6.2.1.
Tratcher
on 16 Jul 2019
Closing as external. You should report this to envoy.
Tratcher
on 16 Jul 2019
@Tratcher is your screenshot from Wireshark or something else? I assume you are referring to my pcap file, but I am not able to correlate your screenshot to what I show in Wireshark, I see a different x-request-id.
coryflucas
on 16 Jul 2019
Yes that was from your wireshark trace.
Tratcher
on 16 Jul 2019
Hmm, my version of Wireshark (3.0.2) does not seem to have any issues decoding any of the packets, including 487:

I also don't see any packets that match your screenshot. I can find both x-request-id values, but never in the same request.
I am also able to reproduce similar errors issue using nghttpx (another http2 proxy), but only if I include x-request-id header with varying values (Guid.NewGuid(), random int, etc).
In an attempt to narrow this down some I tried setting the x-request-id header in my client code to a new Guid value. This triggers similar behavior, but different request headers are impacted. In this case the server side thinks it did not receive a Content-Type header. Because this error doesn't fail down in the guys of Kestrel, I was able to add a middleware to log the request headers and the logs show that multiple copies of the x-request-id header and other headers missing. Wireshark tracing does not match this.
I stood up a grpc server running the same proto, but using the old gRPC framework with logging of the request headers and mirrored the traffic to it using Envoy, and it shows the correct headers. Here are the logs for the same request when the Kestrel based version fails:
- Kestrel based:
Host=envoy:10000, :scheme=http, :method=POST, :authority=envoy:10000, :path=/Greet.Greeter/SayHello, x-request-id=e25cb56a-b090-442d-9714-8253c816033c,e25cb56a-b090-442d-9714-8253c816033c,e25cb56a-b090-442d-9714-8253c816033c,e25cb56a-b090-442d-9714-8253c816033c,e25cb56a-b090-442d-9714-8253c816033c,e25cb56a-b090-442d-9714-8253c816033c,e25cb56a-b090-442d-9714-8253c816033c,e25cb56a-b090-442d-9714-8253c816033c
- gRPC based (pseduo headers aren't exposed):
x-request-id=e25cb56a-b090-442d-9714-8253c816033c, user-agent=grpc-csharp/1.21.0 grpc-c/7.0.0 (linux; chttp2; gandalf), x-forwarded-proto=http, x-envoy-expected-rq-timeout-ms=15000, x-envoy-internal=true, x-forwarded-for=172.19.0.3
Then just as a sanity check I through together a basic node http2 server that just logs all the headers it receives. It also doesn't show the duplicate/missing headers that Kestrel does:
- Kestrel based:
Host=envoy:10000, :scheme=http, :method=POST, :authority=envoy:10000, :path=/Greet.Greeter/SayHello, x-request-id=c042c5c6-0e72-4559-ad73-a3e22c788219,c042c5c6-0e72-4559-ad73-a3e22c788219,c042c5c6-0e72-4559-ad73-a3e22c788219,c042c5c6-0e72-4559-ad73-a3e22c788219,c042c5c6-0e72-4559-ad73-a3e22c788219,c042c5c6-0e72-4559-ad73-a3e22c788219,c042c5c6-0e72-4559-ad73-a3e22c788219,c042c5c6-0e72-4559-ad73-a3e22c788219
- Node based:
{
':scheme': 'http',
':method': 'POST',
':authority': 'envoy-shadow:10000',
':path': '/Greet.Greeter/SayHello',
'x-request-id': 'c042c5c6-0e72-4559-ad73-a3e22c788219',
te: 'trailers',
'content-type': 'application/grpc',
'user-agent': 'grpc-csharp/1.21.0 grpc-c/7.0.0 (linux; chttp2; gandalf)',
'grpc-accept-encoding': 'identity,deflate,gzip',
'accept-encoding': 'identity,gzip',
'x-forwarded-proto': 'http',
'x-envoy-expected-rq-timeout-ms': '15000',
'x-envoy-internal': 'true',
'x-forwarded-for': '172.19.0.3'
}
The fact that nothing seems to show these header issues but Kestrel makes me think this is actually a Kestrel issue.
It might be worth noting that adding additional headers to the request changes the number of times the x-request-id header repeats.
coryflucas
on 17 Jul 2019
Ok I was able to get wireshark to decode the frame by disabling most of the other automatic decoders (It kept asserting it was IPA, even after I'd disabled that one). Skipping that frame likely corrupted the hpack state. I'll re-evaluate.
Tratcher
on 17 Jul 2019
Reduced repro:
I was able to extract the request bytes from the wireshark trace as envoy_repro.txt and replay them with this:
using System;
using System.IO;
using System.Net.Sockets;
using System.Threading.Tasks;

namespace ReplayApp
{
    class Program
    {
        static async Task Main(string[] args)
        {
            Console.WriteLine("Starting");
            var file = File.OpenRead("envoy_repro.txt");

            var client = new TcpClient();
            await client.ConnectAsync("localhost", 5005);
            var stream = client.GetStream();
            var responseTask = stream.CopyToAsync(Stream.Null); // relieve pressure;

            var buffer = new byte[1024];
            while (true)
            {
                var read = await file.ReadAsync(buffer);
                if (read == 0)
                {
                    break;
                }

                await stream.WriteAsync(buffer, 0, read);

                // We need a little delay to let requests finish, otherwise we go over the limit
                await Task.Delay(TimeSpan.FromSeconds(1));
            }

            Console.WriteLine("Finished");
        }
    }
}
Kestrel's Http2SampleApp sample functions as the server without modification. And now we can debug it.
Tratcher
on 31 Jul 2019
Ah ha. The problem is with this line:
https://github.com/aspnet/AspNetCore/blob/c703093346c903fc05eb6108c0ef7b8a8205c95c/src/Servers/Kestrel/Core/src/Internal/Http2/HPack/DynamicTable.cs#L38
The dynamic table uses a circular buffer with 128 entries. The second to last request inserted in at the last index (127) and incremented _insertIndex to 0. Then the last request tries to look up entries. Note _buffer.Length - 1 doesn't factor in the input index, it always returns 127. More broadly, this logic doesn't wrap indexes correctly at the end of the circular buffer, not just when _insertIndex to 0. The fix looks something like this:
                var modIndex = _insertIndex - index - 1;
                if (modIndex < 0)
                {
                    modIndex += _buffer.Length;
                }
Related issues
 barrytang
·
89Comments
barrytang
·
89Comments
 davidfowl
·
126Comments
davidfowl
·
126Comments
 danroth27
·
79Comments
danroth27
·
79Comments
 glennc
·
117Comments
glennc
·
117Comments
 clement911
·
129Comments
clement911
·
129Comments
Most helpful comment
Reduced repro:
I was able to extract the request bytes from the wireshark trace as envoy_repro.txt and replay them with this:
Kestrel's Http2SampleApp sample functions as the server without modification. And now we can debug it.