Aspnetcore: Kestrel dies because of Out of Memory exception
One of our MVC projects keeps growing memory, and it seems that Garbage collector dose not do anything with it.
The process keeps growing until it is killed by the OS.
dmesg outputs this log:
[961030.365411] Out of memory: Kill process 3673 (dotnet) score 913 or sacrifice child
[961030.365725] Killed process 3673 (dotnet) total-vm:29592364kB, anon-rss:3565416kB, file-rss:256kB, shmem-rss:0kB
What makes me think that it is related to, GC not working as expected is that, i have periodically called GC.Collect() and memory immediately drops down significantly but still keeps growing in a much slower pace.
Also GC is running under Server mode.
Environment Info
Runtime: .Net Core 2.1
ASP.NET Core 2.1
Web server: Kestrel (directly exposed)
OS: Centos 7

4 Core processor
4GB Memory
Also not sure if it any how related, i thought maybe GC dose not recognize memory limits, so here is the output of ulimit command:
core file size          (blocks, -c) 0
data seg size           (kbytes, -d) unlimited
scheduling priority             (-e) 0
file size               (blocks, -f) unlimited
pending signals                 (-i) 15062
max locked memory       (kbytes, -l) 64
max memory size         (kbytes, -m) unlimited
open files                      (-n) 1024
pipe size            (512 bytes, -p) 8
POSIX message queues     (bytes, -q) 819200
real-time priority              (-r) 0
stack size              (kbytes, -s) 8192
cpu time               (seconds, -t) unlimited
max user processes              (-u) 15062
virtual memory          (kbytes, -v) unlimited
file locks                      (-x) unlimited
Notes
- the apps works as expected on Windows server 2016.
- this may or may not be a duplicate of #1976 but all the issues in there are being tracked separately.
Update
Adding entire dmesg log here as gist to keep things clear.
All 68 comments
Related to https://github.com/dotnet/coreclr/issues/19060 ? /cc @tmds
Are you running this in a container? Enforcing a memory limit?
dmesg outputs this log: [961030.365725] Killed process 3673 (dotnet) total-vm:29592364kB, anon-rss:3565416kB, file-rss:256kB, shmem-rss:0kB
Is there some more info in dmesg about this?
@tmds No, it's not inside a container. (which is why i think cgroup is not the case here). And thus no memory limit other than OS defaults. (as far as i am aware)
Is there some more info in dmesg about this?
No, dmesg contains that one single line of log that is related to this issue.
Ah, I've seen dmesg OOM logging that was more verbose.
Your system may be out of swap+ram and the kernel is killing a process to free some up.
@tmds What do you think about GC not working?
I have deployed the app again, and this time i will also monitor swap info.
What do you think about GC not working?
With anon-rss:3565416kB and 4GB Memory, .NET Core still be waiting a bit before GCing.
@tmds Thanks for the response, any suggestion on how to fix? if that's the case.
Is this a machine dedicated for running Kestrel? Or does it run other applications/services?
You could install more RAM.
You can also configure the system so it becomes less likely the kernel will kill the dotnet process, but pick another instead. With the default config, probably dotnet looks like an interesting target because it is using a lot of RAM.
It is a dedicated machine for Kestrel.
Adding more RAM is not really an option, because the app dose not really need that much. dotnet should not be using that amount of memory anyway.
However event if i add more RAM, same thing will happen again, but a bit later, right?
I'm surprised no other things are running on the machine.
It's unfortunate dmesg has so little information why the process is killed.
dotnet should not be using that amount of memory anyway.
the amount of physical ram is used to determine how much memory dotnet can use.
If you want to lower it, you can run it in a cgroup.
If you run it as workstation gc it will be more agressive. How many cores is the machine because server gc has a heap per core so can easily swallow a lot of ram as it's baseline before gcing. Workstation will be more agressive (at the cost of more gc activity)
the amount of physical ram is used to determine how much memory dotnet can use.
as an example, with 4GB memory dotnet should not keep allocating memory, because the limit is already set by amount of physical memory, so why do we need to enforce the limit via cgroup?
@Drawaes Yeah, the machine has 4 Cores and is running under ServerGC. (i believe having ServerGC enabled is a reasonable thing to have)
Might want to raise an issue in https://github.com/dotnet/coreclr
That is less than 1gb per core (minus os overhead) which is pretty low for the server gc.
The default GC segment sizes aren't going to be good for you.
https://docs.microsoft.com/en-us/dotnet/standard/garbage-collection/fundamentals#ephemeral-generations-and-segments
@Drawaes ah i see, let me add 4 GB to the machine and observe the result.
as an example, with 4GB memory dotnet should not keep allocating memory, because the limit is already set by amount of physical memory, so why do we need to enforce the limit via cgroup?
By default it will take into account the physical memory limit. If you _want_ to force dotnet to a lower value, you _can_ use a cgroup.
I have deployed the app again, and this time i will also monitor swap info.
To figure out why the system does an OOM kill. These are interesting: free memory, free swap and the dotnet proc status file.
let me add 4 GB to the machine and observe the result.
If this reproduces well, let's try and figure out the root cause before adding more RAM.
@HassanHashemi I noticed you included another line in the dmesg output. The full output I was expecting was something like https://stackoverflow.com/questions/9199731/understanding-the-linux-oom-killers-logs. This includes a lot of information on where the memory is spent.
@tmds yeah, sorry. that was missed in copy+paste phase. I will include the entire log.
added the log as a gist
The dotnet process is using all your swap. It's 5.5GB (2GB swap, 3.5GB RAM).
...
[961030.365235] Free swap  = 0kB
[961030.365236] Total swap = 2097148kB
...
[961030.365243] [ pid ]   uid  tgid total_vm      rss nr_ptes swapents oom_score_adj name
...
[961030.365374] [ 3673]     0  3673  7398091   891418    3367   513091             0 dotnet
This could mean the GC isn't triggered. It can also mean your app has a memory leak.
I've checked: .NET Core is properly detecting the amount of physical RAM as a limit on my system. So probably your app has a memory leak.
@tmds If that's the case, why would explicitly calling GC.Collect() frees up the memory?
a leak will survive GC.Collect()..
A simple test is set it to workstation gc. If you don't get the oom crash then it's not a leak because it shouldn't be able to clean up a leak.
@tmds If that's the case, why would explicitly calling GC.Collect() frees up the memory?
Calling GC.Collect may be postponing the OOM in case of a memory leak.
How much memory does it free up?
If you want to know what .NET Core is using as a memory limit you can do this:
$ wget https://raw.githubusercontent.com/dotnet/coreclr/master/src/gc/unix/cgroup.cpp
$ cat >main.cpp <<EOF
#include "cgroup.cpp"
int main()
{
  printf("%zu\n", GetRestrictedPhysicalMemoryLimit());
  return 0;
}
EOF
$ g++ main.cpp
$ ./a.out
16814272512
For me this is 16GB.
This value is used by the GC. The GC is not aware where the limit comes from (cgroup, amount of RAM, ...).
here is the graph representing the GC path.
That's the Redis ResultBox cache rooting the objects; though will keep at max 64 items. Have added PR for it https://github.com/StackExchange/StackExchange.Redis/pull/927
Thanks @tmds i have followed what you pointed out and found that GC is running correctly.
However after investigating with MemProfiler on a Windows server and also local development machine, with Server GC enabled, the ModelExplorer is keeping some objects, here is the diagram representing the GC path.
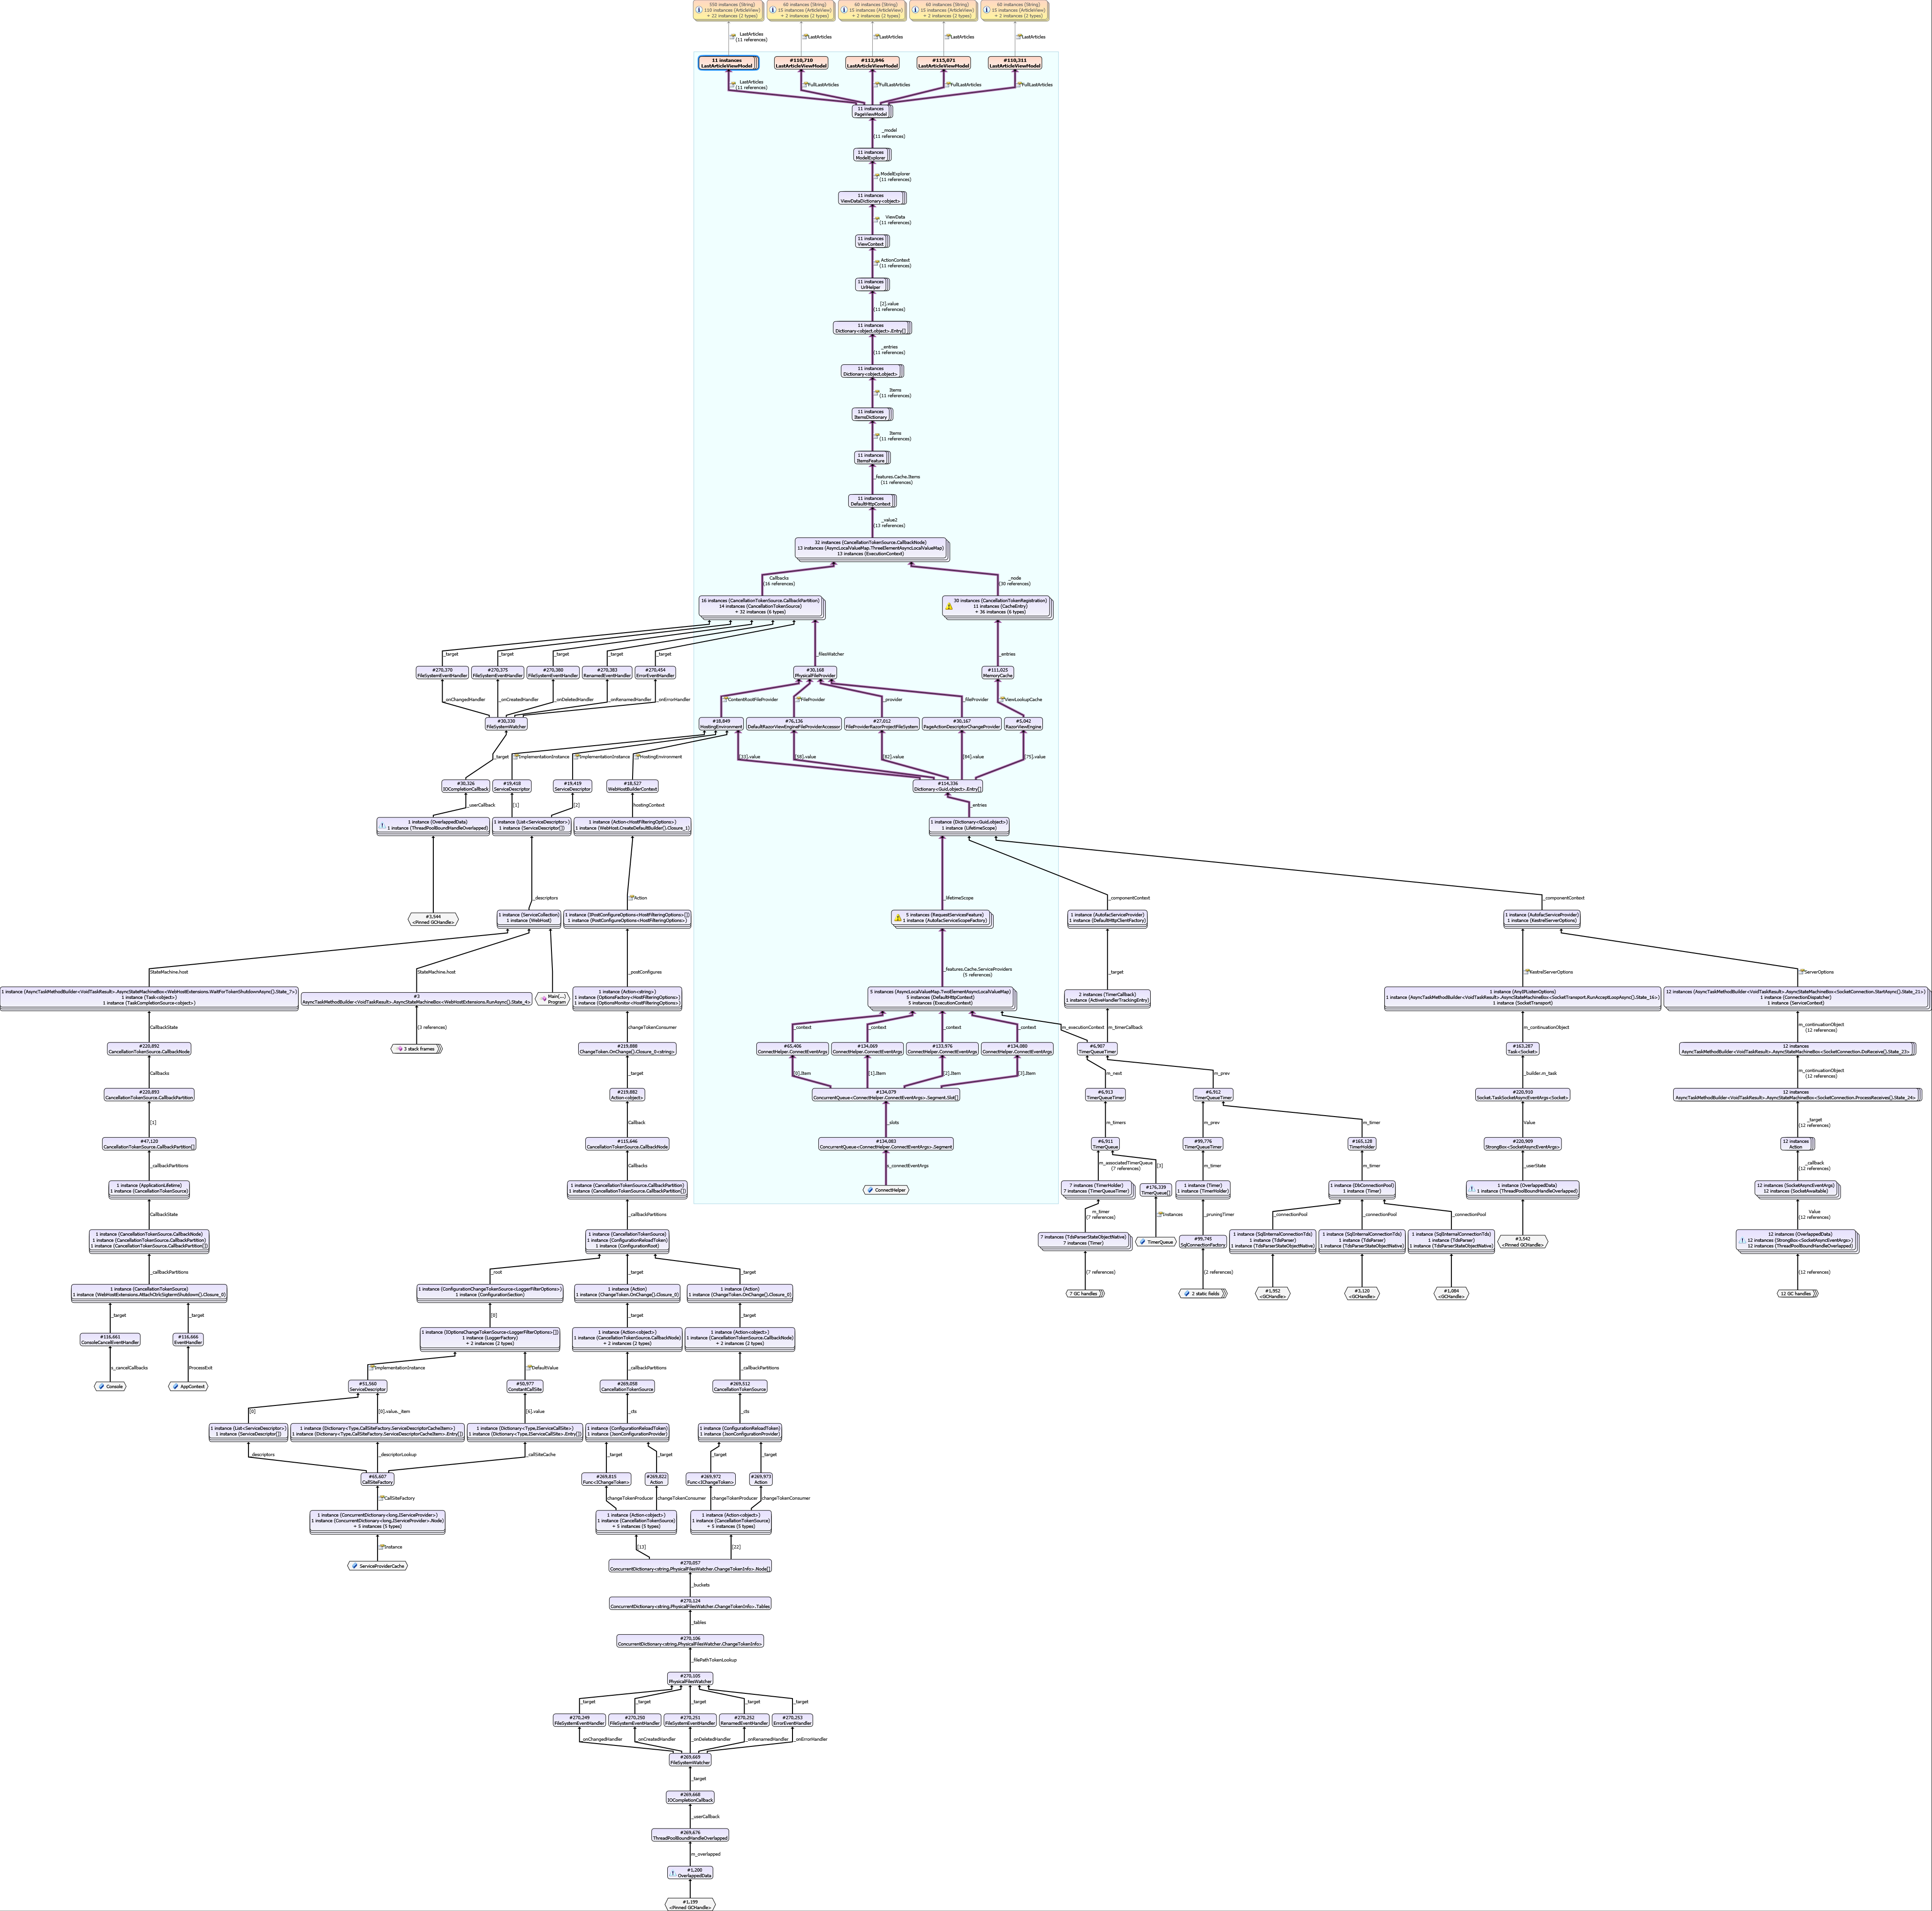
Thanks @benaadams https://github.com/StackExchange/StackExchange.Redis/pull/927 fixed the issue regarding Redis.
I have updated the diagram (Removed Redis related stuff)
This diagram helps, thanks @HassanHashemi ! It looks like we have a big problem with the interaction between the IHttpContextAccessor and the way we use ChangeTokens to cache view information.
cc @pranavkm
@HassanHashemi is this during development or are you seeing these types of issues in production?
@davidfowl
I'm glad it helped. this actually happened on production server (CentOS).
Interesting, do you have cshtml files on your production server?
@davidfowl No, they are built into a library. (Project.Views.dll)
Which confused me also, i was expecting DefaultRazorEngineFileProviderAccessor to have this bahavior on cshtml files. it kind of did not make sense to have FileSystemWatcher for InMemory Views (located inside dll files).
This led me to check if it's loading *.cshtml files. (a few more info here)
Some of the paths should be fixed (right hand side, Sql/DbConnectionPool etc) in the .NET Core 2.2 preview https://blogs.msdn.microsoft.com/webdev/2018/08/22/asp-net-core-2-2-0-preview1-now-available/
@benaadams Why? any related details?
@benaadams Why? any related details?
Removed capturing of asynclocals into lazy initalized static timers; such as the ConnectionPools
https://github.com/dotnet/corefx/pulls?utf8=%E2%9C%93&q=is%3Apr+author%3Abenaadams+is%3Aclosed+asynclocals
Hmm.. that might have been in .NET Core 2.1.x?
Try updating to latest System.Data.SqlClient 4.5.1 from NuGet? https://www.nuget.org/packages/System.Data.SqlClient/
It's already 4.5.1 (together with EF Core 2.1.1).
@HassanHashemi are you using Razor Pages or MVC views (It doesn't matter I'm just curious)?
MVC views only.
I'd be surprised if this alone was responsible for the OOM. Even if you have issues with rooting the HttpContext, you'd have one per file or directory and that's a finite set. What else does the profile show?
@davidfowl just followed the roots that were part of my code and were expected to be reclaimed by GC.
I honestly have no idea what types in Aspnet core namespace should be followed too. (There is plenty of them)
I'd be surprised if this alone was responsible for the OOM. Even if you have issues with rooting the HttpContext, you'd have one per file or directory and that's a finite set. What else does the profile show?
The objects at top of this tree grow in count as number of request go up. This app handles 100 request per second and fills 4GB in 3 days.
@davidfowl @benaadams
So i have managed to isolate the stuff a bit more and created a table from objects that survived Garbage collector, Objects in following table are mostly objects that live as Gen2.

Let me know if GC roots are needed also. though almost all of them are somehow related to AsyncLocal implicitly keeping references.
@Tratcher Is this going to be fixed any time soon?
This wasn't a single issue, it was a whole category of issues. Several linked work items were created and some of those have already been fixed in the 2.2.0 previews. https://github.com/aspnet/Mvc/issues/8362 looks most directly related to your last post.
We addressed it in 2.2, we can consider patching this in 2.1 but it might be too big of a change to do that. I'll discuss it with some people.
cc @muratg @Eilon @DamianEdwards
Are you running this in a container? Enforcing a memory limit?
dmesg outputs this log: [961030.365725] Killed process 3673 (dotnet) total-vm:29592364kB, anon-rss:3565416kB, file-rss:256kB, shmem-rss:0kB
Is there some more info in dmesg about this?
@tmds we are having a similar issue in a container, the Kestrel is not responding to a ping service. (service timeout) which kills the container. we have set soft limit 512mb and hard limit 1gb.
at this point, we are not 100% sure if it is memory issue, the memory usage is ~70%, but we notice when the server stopped responding, our thread count is 150+. (when the app is idle, it is ~40).
@tmds do you have any suggestions on diagnosing the issue?
150+ threads is a lot for an app you're trying to limit to 512mb/1gb of memory. Most linux distros reserver 8mb of virtual memory per thread/stack by default. It seems like you might be experiencing a problem related to threadpool starvation. If you're not sure what's consuming all of these threads, you can investigate by taking a memory dump (the createdump utility next to libcoreclr.so is useful for this) and examining it with lldb/sos.
@HassanHashemi how does it behave in the newly released 2.2?
@benaadams I have tested this locally under Profiler and it was completely fixed. 👍
Will try it in production later this week.
Thanks @benaadams @davidfowl
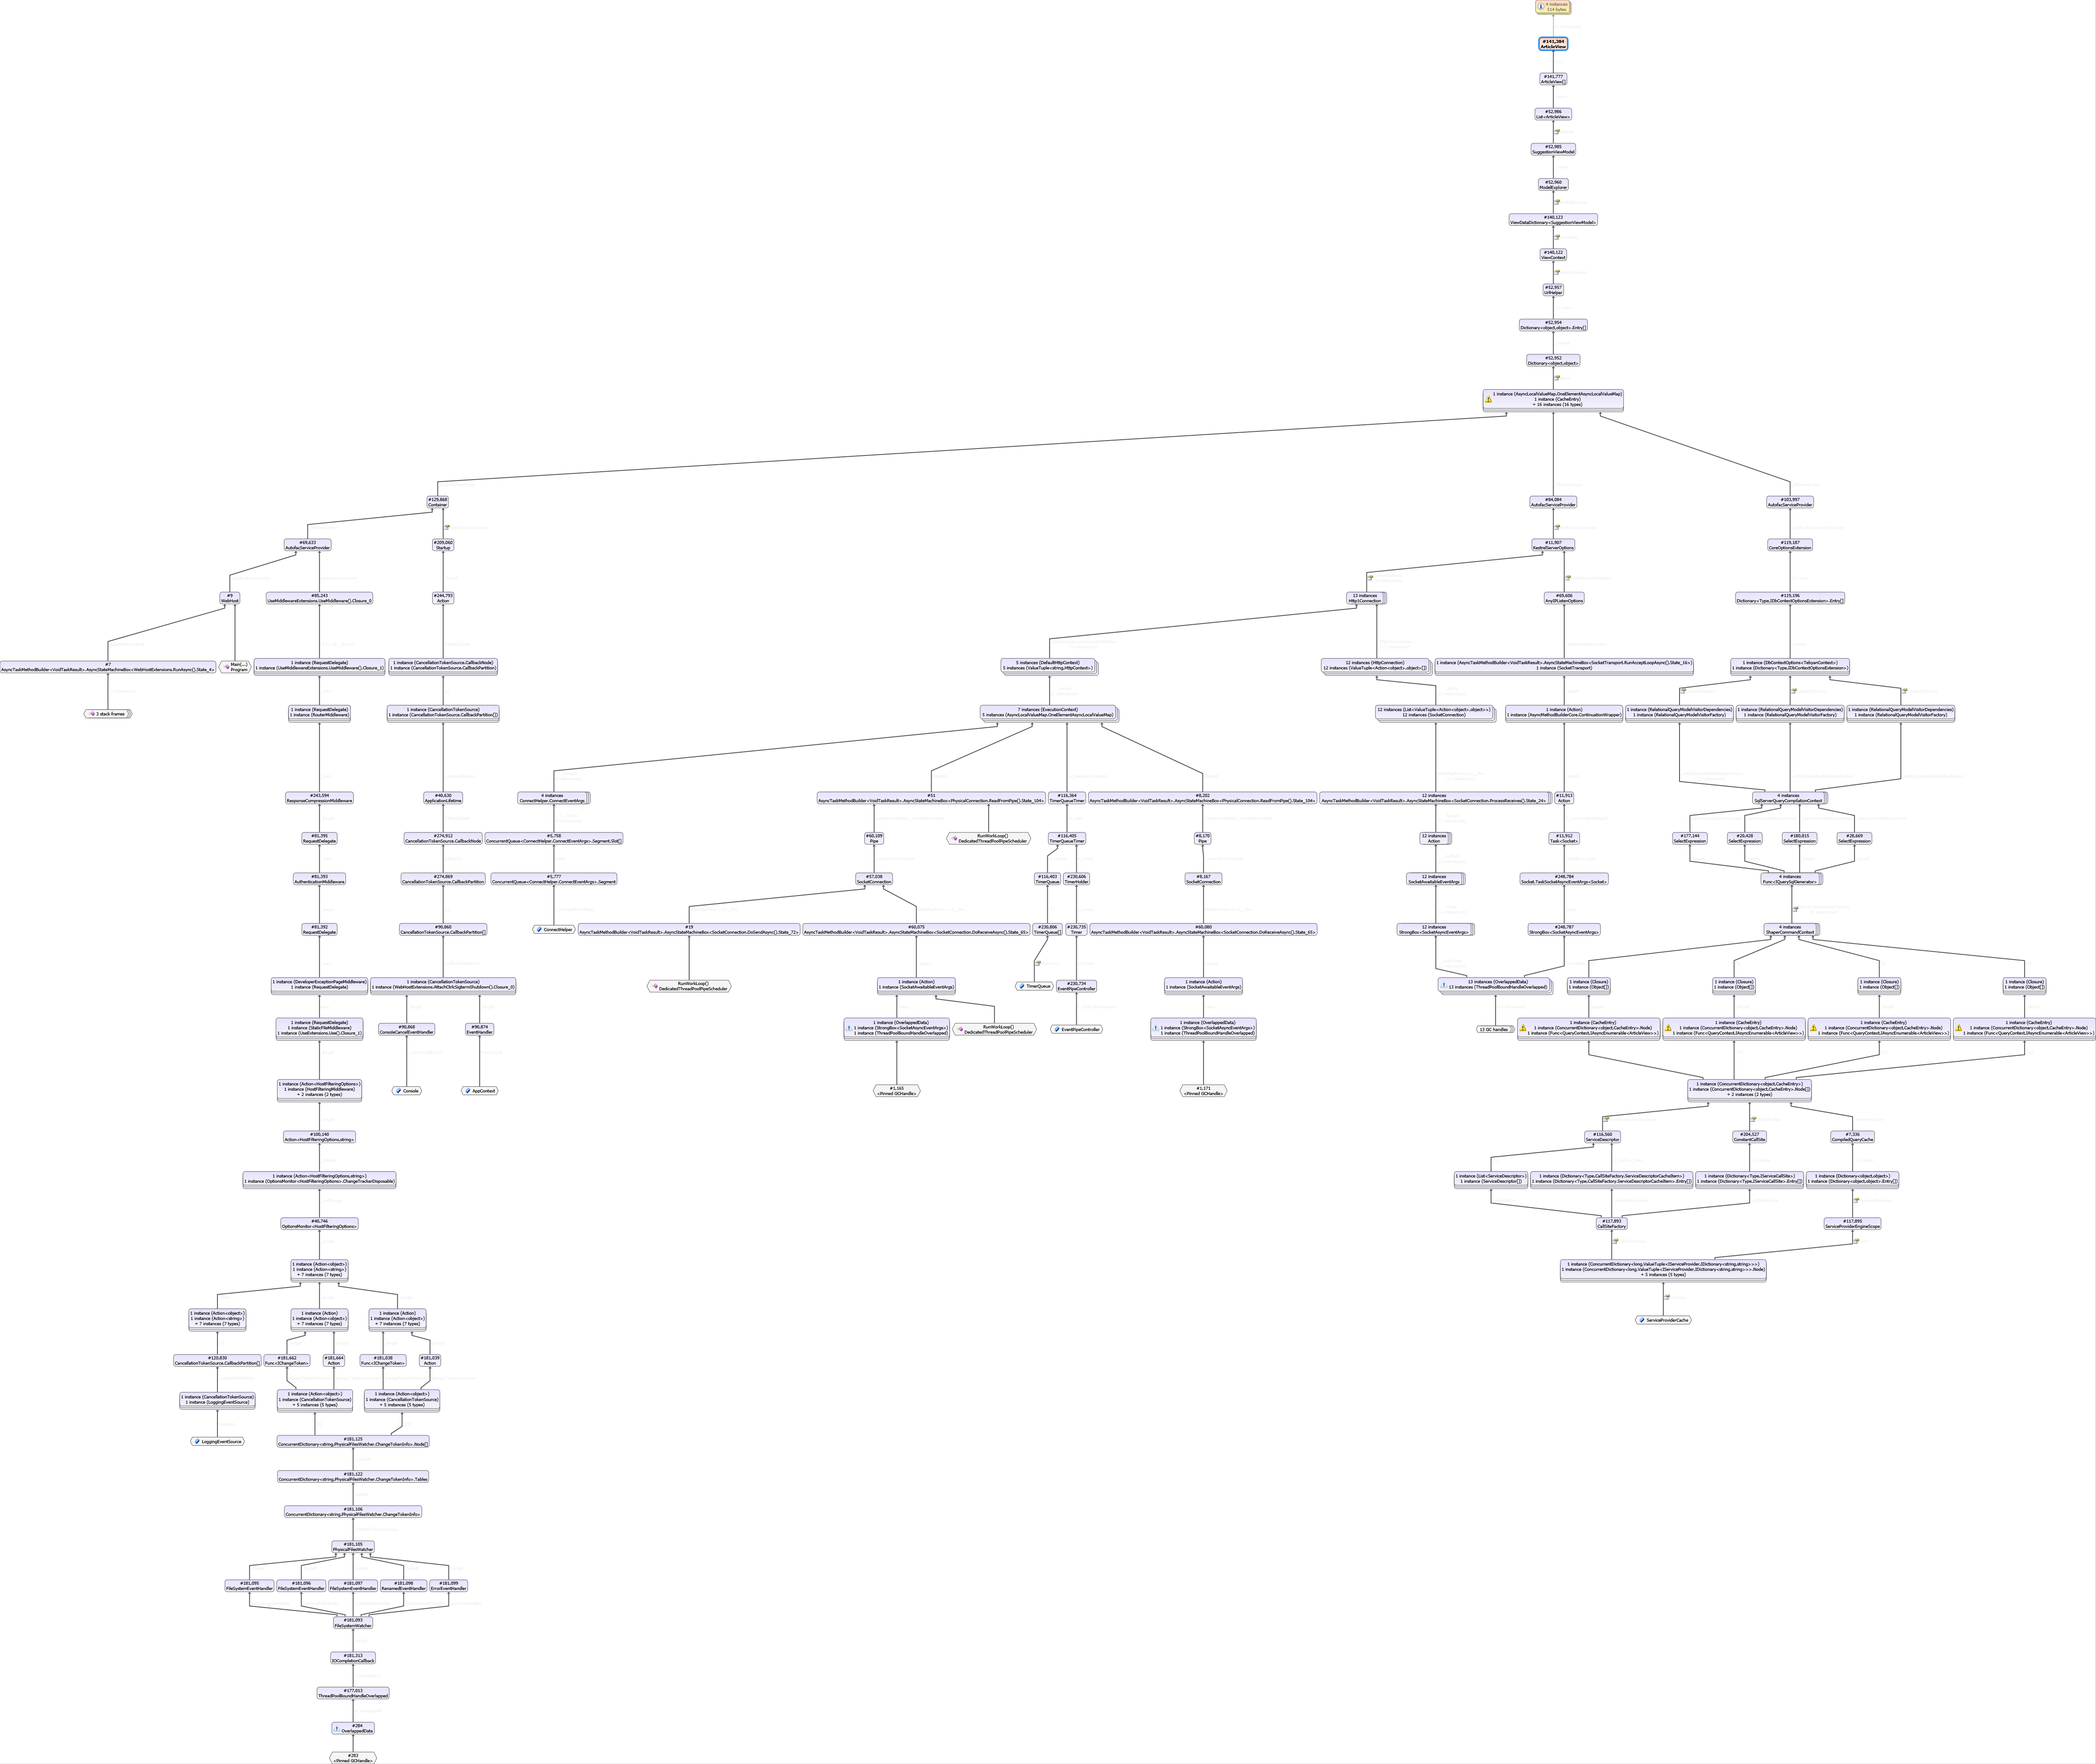
@benaadams @davidfowl I believe this thing is still there and leaks a small bit of memory per request (for 13 million request it leaks a few hundred MB).
So @benaadams what are your thoughts?
@HassanHashemi is that in an idle state? How many requests had it done? (as there doesn't seem too many instances handing around in that diagram)
Unless the number after a # is also an instance count? However that doesn't seem to make sense as the numbers are way too high :)
@benaadams It's in idle state.
Yes, It dose not leak too much memory. (less than 1 GB for 13 million requests from a core dump i received from a Linux production server)
@HassanHashemi Took a quick look at there are 2 areas of interest here:
- StackExchange.Redis - It's capturing the execution context when the initial connection to redis is made. This will end up capturing any AsyncLocals hanging around on the request at the time of connection. That's the call to ReadFromPipe capturing the ExecutionContext that ends up capturing the HttpContext. cc @mgravell
- I'm still not sure what's holding onto the ArticleView. I'm still trying to figure out this part of the object graph:
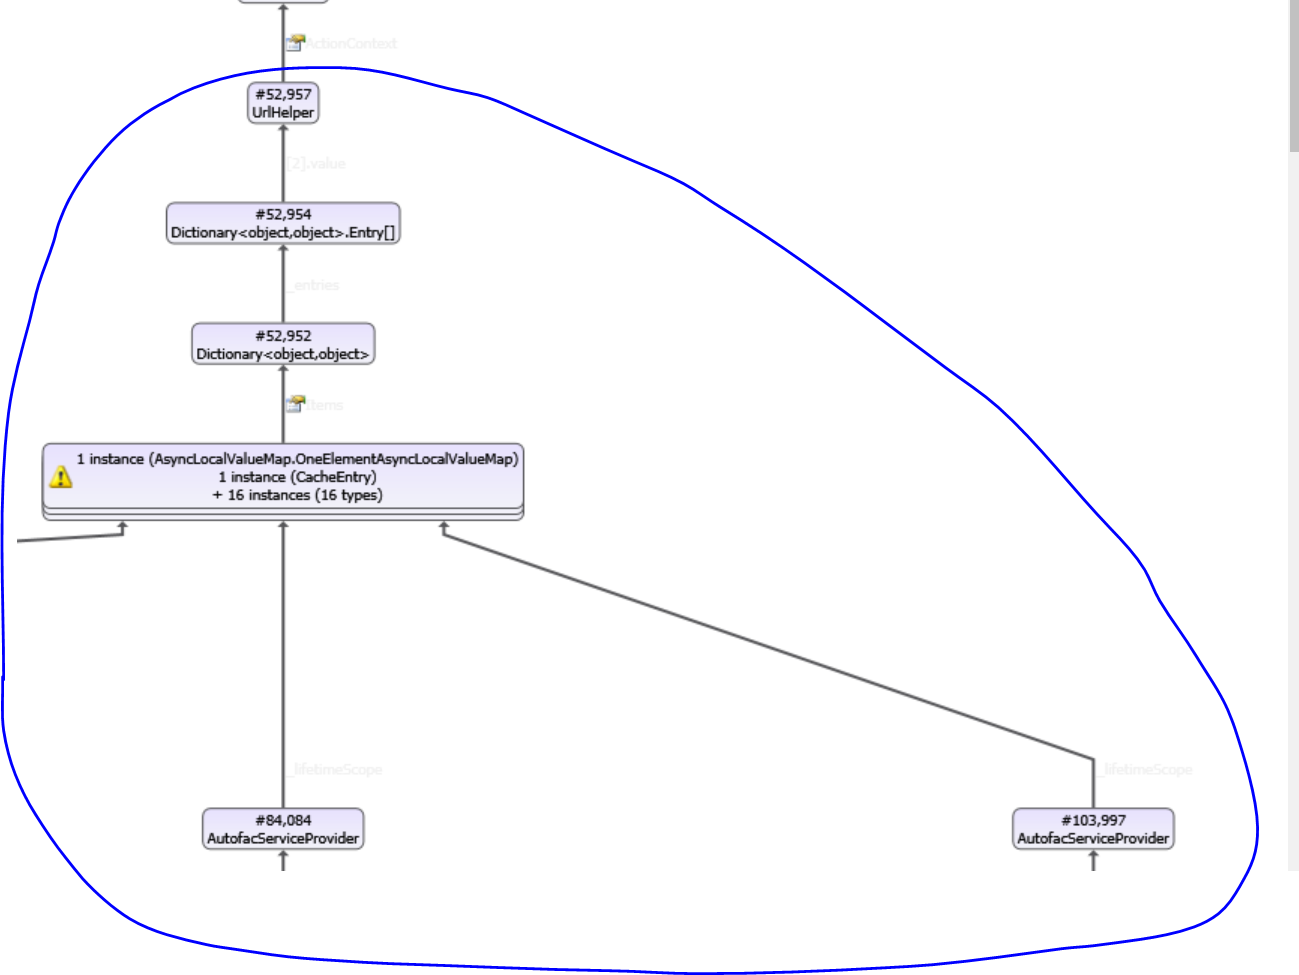
Are you using the MemoryCache anywhere with these objects?
@davidfowl No memory cached is used in the app, However i see some trace of EF down the graph, might that be related?
If you can get more data about what's holding onto UrlHelper it would help. What is that Dictionary<object, object>? Is it HttpContext.Items? Then which object is holding onto that Dictionary<object,object>? dotMemory for example shows gc roots like this:
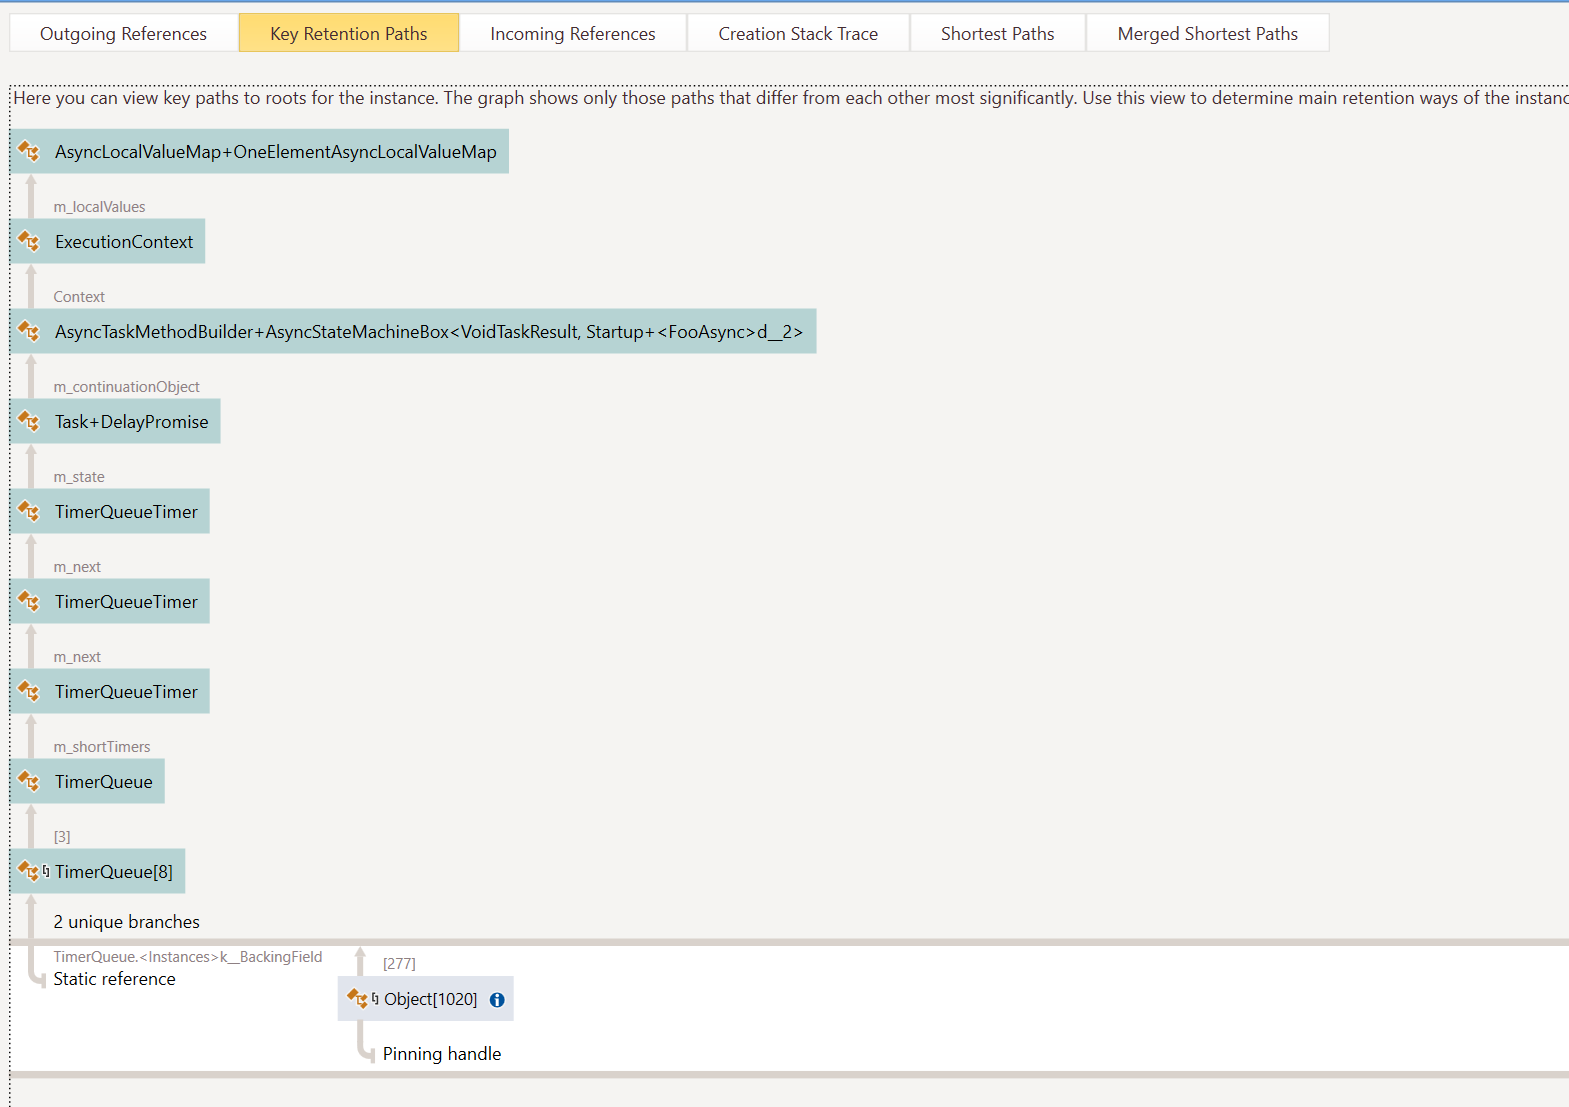
I'd like to see something like this for the UrlHelper
I need to see what’s holding onto UrlHelper. The GC roots of that.
@davidfowl @benaadams
It turns out that either Jetbrains guys have not added some thing that is obviously needed for a profiler "export as image!" or i could not find the button for that.
Any way, here is a bunch of screenshots, I will post better pics if necessary.
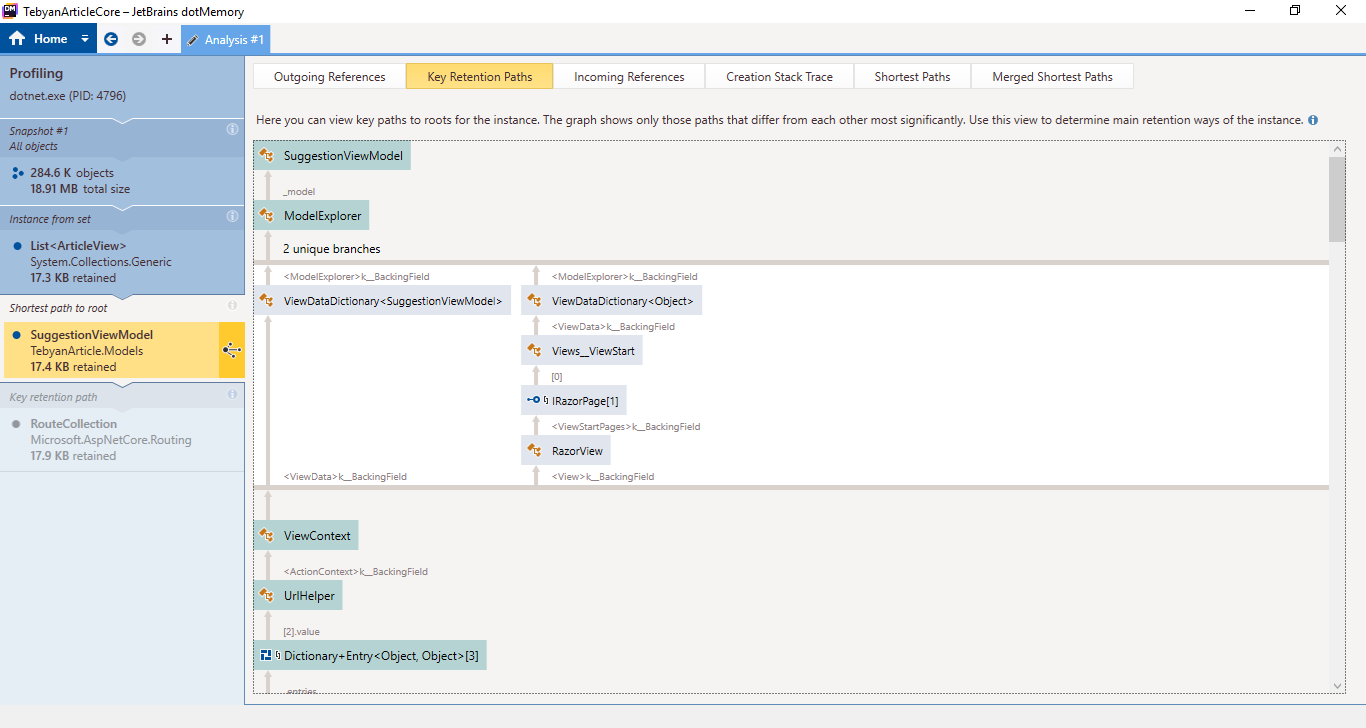
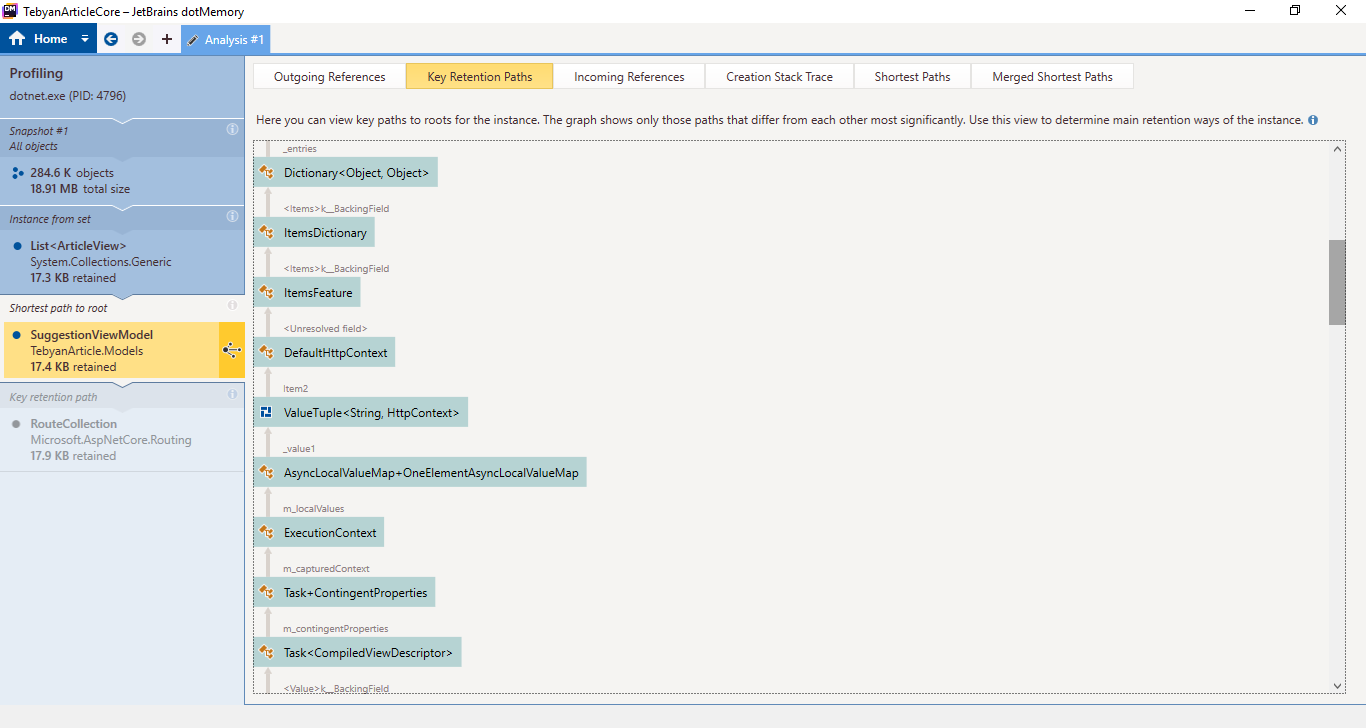
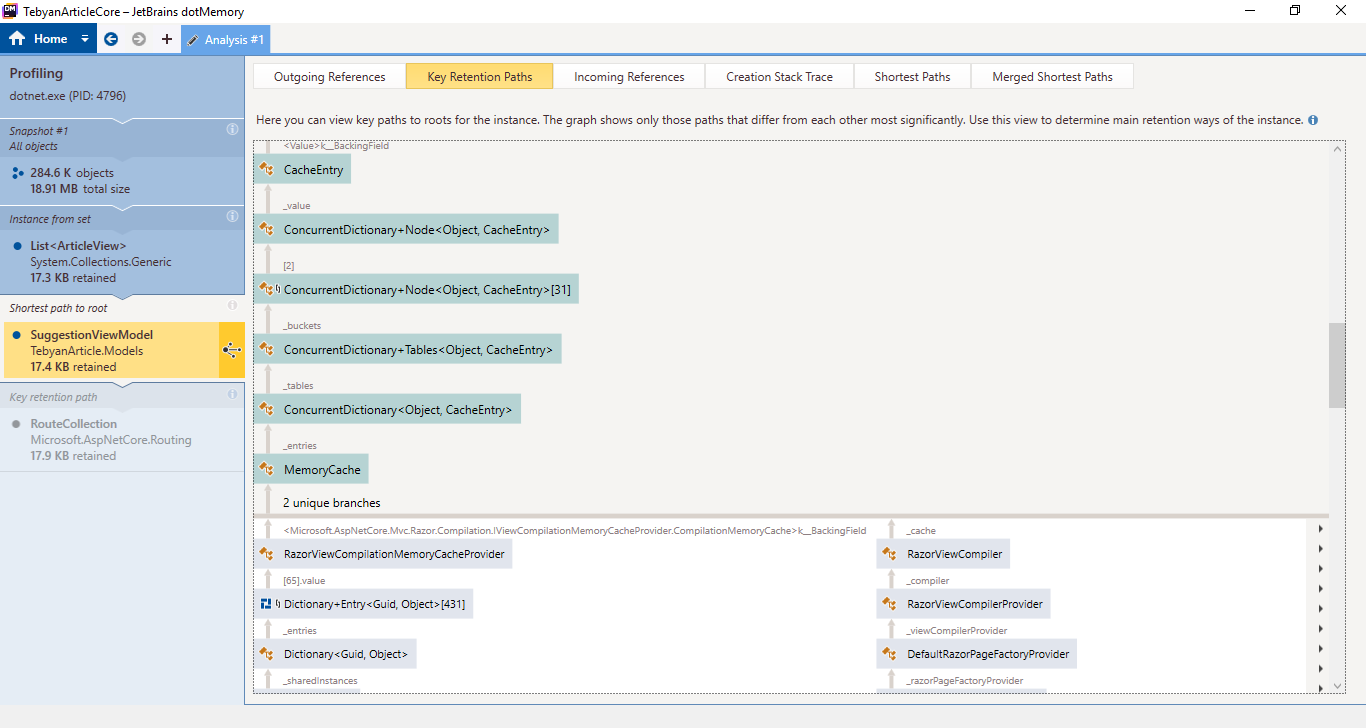
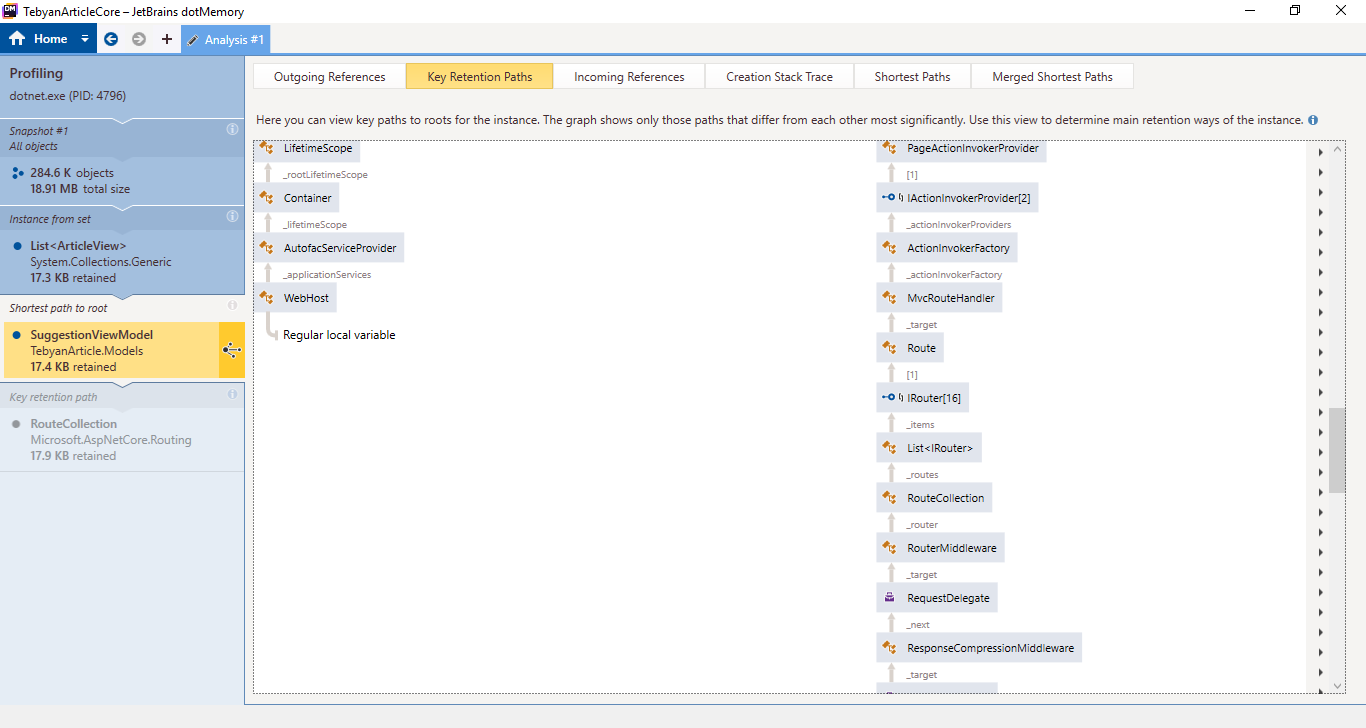
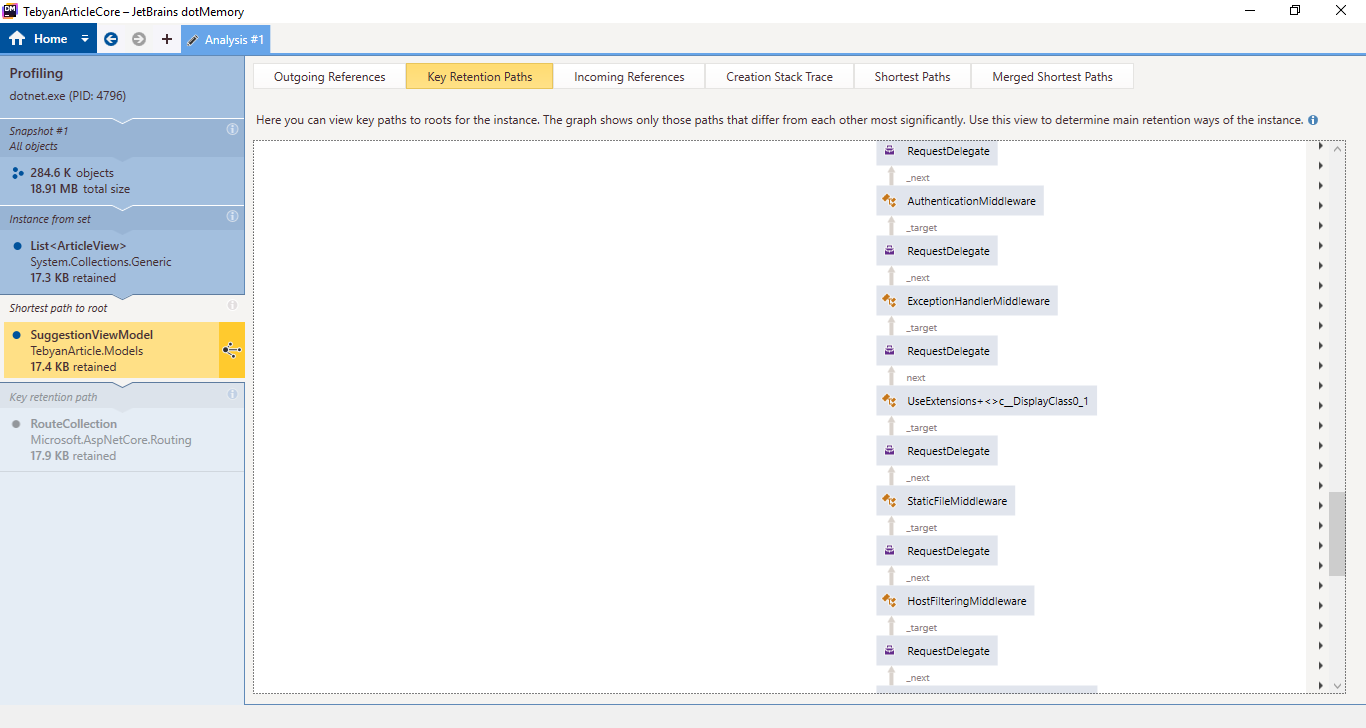
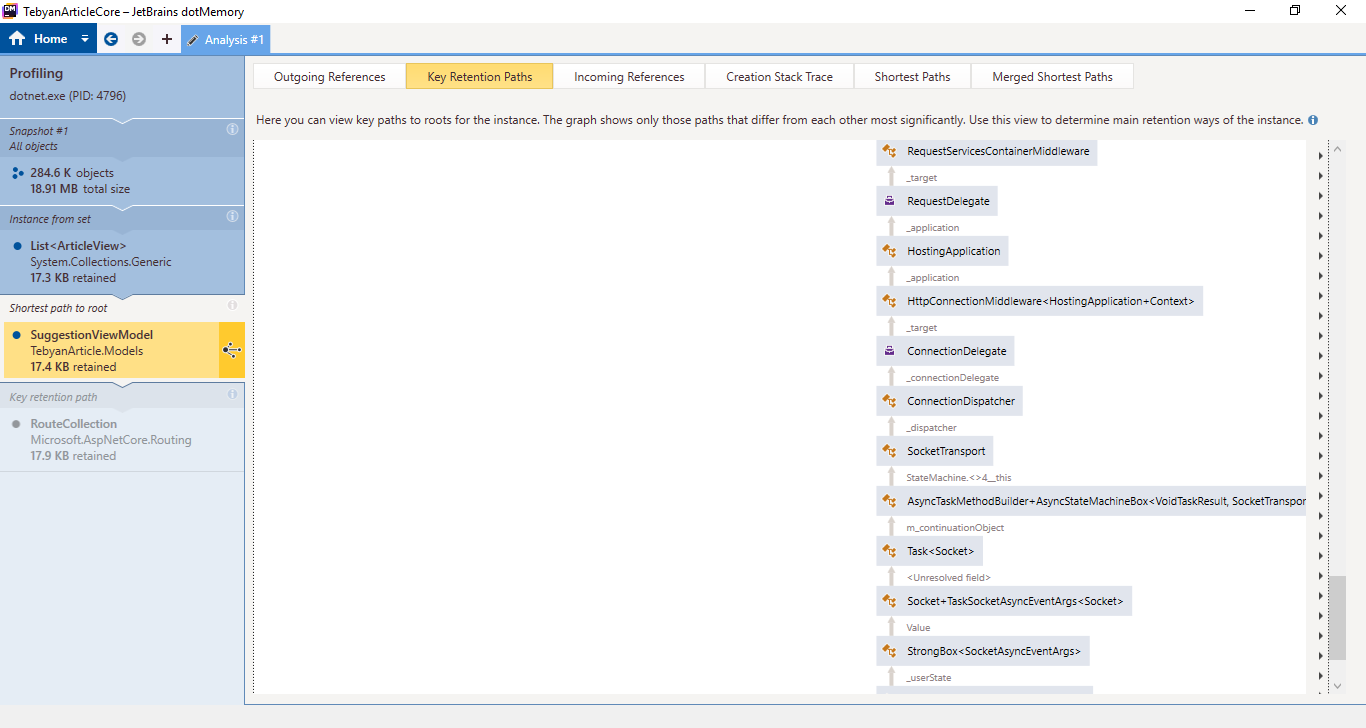
And last one (Contains duplicates)
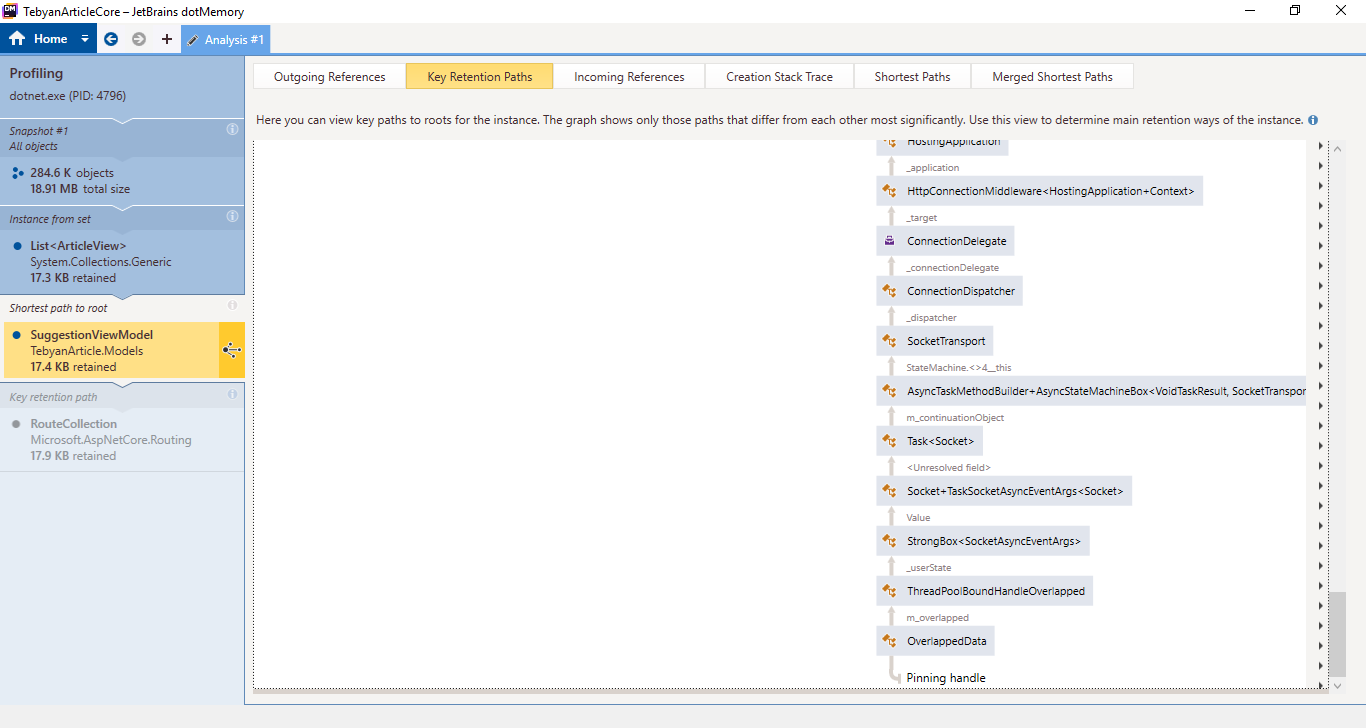
OK, hmm I thought we verified that the ExecutionContext wasn't captured on Tasks created as a promises (aka TaskCompletionSource). It seems like the Task\
cc @stephentoub @pranavkm
This will be less of an issue once we backport https://github.com/aspnet/AspNetCore/pull/6036
I'll look after the new year. Most likely if that is the case, it was a regression introduced in https://github.com/dotnet/coreclr/pull/17407. Can you please open an issue?
(actually probably https://github.com/dotnet/coreclr/pull/9342)
We periodically close 'discussion' issues that have not been updated in a long period of time.
We apologize if this causes any inconvenience. We ask that if you are still encountering an issue, please log a new issue with updated information and we will investigate.