Aspnetcore: Performance bottleneck issues under load
We've been running into some performance issues while load testing (500-1000 requests per second, per node, DS4_v2 in Azure). The cause isn't always the same - sometimes our backend API will have momentary lag for a few requests, other times we hit a network limitation on Azure, etc. But the result is always the same - the application is unable to fulfill requests quickly enough, eventually leading to backend calls never completing, and front-end client requests being accepted and piling up. Thread counts grow, CPU spikes to 100%, and memory expands as a result. If we stop incoming requests, everything returns to normal in a couple minutes once the existing queued client requests complete (or receive cancelation tokens). While an issue is occurring, new incoming connections seem to end up in "limbo" - they are quickly accepted, added to the thread pool, and then end up getting suck waiting for a running thread. Services are async all the way.
We've seen this behavior with both HttpSys and Kestrel, in both Kubernetes (Linux) and Service Fabric (Windows) environments. Additionally, we've seen very similar behaviors on two different services written with very different architecture designs. We've seen this in different stages from ASP.Net Core 1.0 beta up including 2.1
At this point, it seems like a design feature - "_keep accepting requests, no matter what else is happening, ASP.Net Core will not be the bottleneck_" sort of thing.
We've come up with various potential solutions, such as improved load balancers, rate limiting, etc. But there are a few issues with these approaches since they all handle this issue further up the chain.
- nodes must be limited to 40-50% capacity _just to be safe_,
- they aren't responsive to changes in environment or performance - any limits we set must be recalculated anytime we add capacity or change VM size/layout, or performance of our backend changes.
So, questions:
- Is my assessment of this behavior correct, or am I missing some critical piece?
- Is there any backpressure mechanism where we can respond to backend latency or environmental factors by returning failure (500s, for example) rather than processing a request (or even waiting for processing). Given the state that request threads end up stuck, writing middleware would seem too late to catch these, as the piling requests never get that far.
I'm open to any options or suggestions - thanks!
All 12 comments
@sebastienros - any thoughts on this?
Looks like threadpool starvation. Would you mind trying to use Libuv instead on Sockets (new default in 2.1). I would like to know if you are hitting the same issue as some other developers have already reported, or something different.
Here is an example:https://github.com/aspnet/Benchmarks/blob/master/src/Benchmarks/Program.cs#L104
In the meantime I am starting an internal discussion about how to handle throttling in your case.
Thanks!
It’s absolutely a thread starvation issue - back in the 1.0/1.1 days, we mitigated it by increasing the minimum worker thread count to 200, which pushed back the limit a bit.
And I’ll certainly try that setting, but we saw a pretty large backend/latency performance benefit going from 2.0 to 2.1 - so it’s possible that it will just be trading one issue for another.
Most of the perf is from the runtime and aspnet improvements not related to Sockets/Libuv. Sockets has improved, to the point that it's as good as Libuv now, but some micro benchmarks might be better on one or the other. We'd prefer to only have Sockets to have a single managed stack (Libuv is native).
My goal is to unblock you quickly, hopping Libuv is the key here, and have enough repro cases so we can improve Sockets to work as well in these cases.
@jmlothian I'm suspicious because of this:
Services are async all the way.
Are you sure? Have you looked at a dump to verify? Did you try increasing the number of threads in the thread pool to see if this helps the problem?
I'd bet that something in your code (or code you're calling into) is claiming to be async but is indeed doing synchronous things. Another issue might be other things in the same progress potentially overusing the thread pool (like TPL data flow?).
@davidfowl - We did set the thread count higher as a stop-gap a long time ago, and it helped. But there's a bit of diminishing returns there.
I'm going to do some digging to see if I can find any other potential blockers - but in our code itself, we've eliminated any synchronous calls, it would more likely be direct thread locking somewhere. This code is _very_ linear - there isn't a lot of performance benefit from parallel execution.
Otherwise, the only other culprit would be Application Insights logging.
I have looked at memory dumps, but at the time I was looking for synchronous blocking (.Result and the like) rather than threads in general, so I'll generate a new one and take a look.
I spent today setting up a clean test environment, so tomorrow I should be able to try a few things.
Thanks!
@jmlothian awesome! Looking forward to seeing what's running on those threads!
Sorry for the delay. There was indeed a lock around some legacy code intended to help re-use customized httpclients from the 1.1 days. Removed and replaced with HttpClientFactory, upgraded a few other sections with Polly, and tweaked Kestrel concurrent limit to 1000 and got a performance increase from 1,700 requests per second to about 2,000 rps per node (and now appropriately maxing out the CPU before failure). Threads no longer explode, but manage between 100-250 even over capacity.
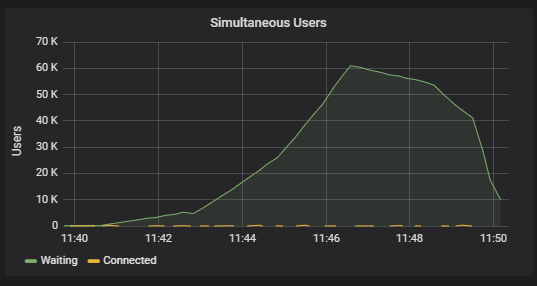
All that said - I'm still concerned a bit at the behavior I'm seeing of connections piling up waiting when capacity is reached. I would really like to have a method to begin denying requests, rather than have them wait. Here's a graph of a load test as it moves from 2,000 rps to 2,100, showing the numbr of connections waiting for a response:

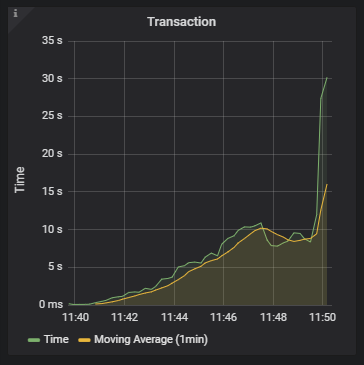
Fortunately, the site stays responsive now (when the test reduces the volume, the waiting users eventually get served). External client transaction time:

The average start/end request duration internally only changes from ~50ms to ~120ms. I can potentially hook a diagnostic observer into Microsoft.AspNetCore.Hosting.BeginRequest / EndRequest, and get averages a few times a minute to signal another tier for cluster scaling events (although CPU should be enough on its own). Likewise, I can tap into that for load balancer health-checks (which would likely be fine if I were testing with something other than the Azure Basic LB, and could rate-limit dynamically rather than turn the entire node off/on).
I'm still left hoping for a way to simply reject connections over capacity - and maybe I'm just trying to get that last 1% / extra backup failure scenario, and I'm trying to pull too much Ops-level into the software.
I'm still left hoping for a way to simply reject connections over capacity - and maybe I'm just trying to get that last 1% / extra backup failure scenario, and I'm trying to pull too much Ops-level into the software.
When you say connections, you mean requests right?
Yes and no. I think there’s utility in being able to reject the connections before becoming requests, but that’s probably introducing a bit more complexity and interplay between the service and kestrel/httpsys/etc than would be optimal in a tidy modular system.
I’d settle for rejecting requests, if there was a way to do so in a timely manner - like pruning the request queue for anything that’s been waiting on a thread for longer than X milliseconds. Basically, I would rather the requests that make it through be returned quickly, than have all requests guaranteed to be served, even if it takes several seconds. A fast fail rather than a slow, cumulative death.
There’s already a connection limit with kestrel so if you want to outright have a max on the concurrent connections then you can configure that.
A simple middleware can be written to reject requests based on a number of concurrent requests.
I've been tinkering with the Kestrel connection limits, and hadn't actually gotten them to do much of anything (the graphs above showing 60k pending users were with Kestrel set to 1000 max connections). All of my load testing has been either in Service Fabric or Azure Kubernetes - both of which use the Azure Load Balancer. Today I tried load testing against a standard VM, which tanks the response time, but I see requests actually being rejected as I would expect.
Layer-4 load balancing is bit deeper than I'd like to dig, but I'm guessing that anything at that layer is likely going to confound any specific kind of connection/rate monitoring I'd like to do. I'm not sure the information is actually available at the software level to act on it appropriately, because it seems like the LB itself is holding connections pending before they even reach the service - judging by client-side transaction time skyrocketing, but the server-side transaction time only changing by 50-100 milliseconds.
I think I'm going to have to just take it as-is and let the infrastructure do its part.
Thanks for the help!
Most helpful comment
Sorry for the delay. There was indeed a lock around some legacy code intended to help re-use customized httpclients from the 1.1 days. Removed and replaced with HttpClientFactory, upgraded a few other sections with Polly, and tweaked Kestrel concurrent limit to 1000 and got a performance increase from 1,700 requests per second to about 2,000 rps per node (and now appropriately maxing out the CPU before failure). Threads no longer explode, but manage between 100-250 even over capacity.
All that said - I'm still concerned a bit at the behavior I'm seeing of connections piling up waiting when capacity is reached. I would really like to have a method to begin denying requests, rather than have them wait. Here's a graph of a load test as it moves from 2,000 rps to 2,100, showing the numbr of connections waiting for a response:
Fortunately, the site stays responsive now (when the test reduces the volume, the waiting users eventually get served). External client transaction time:
The average start/end request duration internally only changes from ~50ms to ~120ms. I can potentially hook a diagnostic observer into Microsoft.AspNetCore.Hosting.BeginRequest / EndRequest, and get averages a few times a minute to signal another tier for cluster scaling events (although CPU should be enough on its own). Likewise, I can tap into that for load balancer health-checks (which would likely be fine if I were testing with something other than the Azure Basic LB, and could rate-limit dynamically rather than turn the entire node off/on).
I'm still left hoping for a way to simply reject connections over capacity - and maybe I'm just trying to get that last 1% / extra backup failure scenario, and I'm trying to pull too much Ops-level into the software.