Aspnetboilerplate: The memory is so high!
How to solve the problem of memory footprint is too big?
 SmallShrimp
All 56 comments
How big is it exactly? Did you do any profiling?
El El lun, 26 de diciembre de 2016 a la(s) 7:44 p.m., SmallShrimp <
[email protected]> escribió:
How to solve the problem of memory footprint is too big?
—
You are receiving this because you are subscribed to this thread.
Reply to this email directly, view it on GitHub
https://github.com/aspnetboilerplate/aspnetboilerplate/issues/1702, or mute
the thread
https://github.com/notifications/unsubscribe-auth/AIycYVonFcW-xd3Iu3iBcaFIDiZd47r0ks5rMG2UgaJpZM4LV-Qp
.
 wocar
on 27 Dec 2016
wocar
on 27 Dec 2016
I use the IIS, memory is always above 1G ! And i use is the official version of purchase.
SmallShrimp
on 28 Dec 2016
What are the specs of your server and which version of abp are you using?
Are you using the default abp template or the abp zero template? Do you
have any other services running on your iis?
El El mar, 27 de diciembre de 2016 a la(s) 7:40 p.m., SmallShrimp <
[email protected]> escribió:
I use the IIS, memory is always above 1G ! And i use is the official
version of purchase.—
You are receiving this because you commented.Reply to this email directly, view it on GitHub
https://github.com/aspnetboilerplate/aspnetboilerplate/issues/1702#issuecomment-269410789,
or mute the thread
https://github.com/notifications/unsubscribe-auth/AIycYZ5KpYm2DTvwmqJiaDdytCGOQGV2ks5rMb37gaJpZM4LV-Qp
.
wocar
on 28 Dec 2016
Hi @SmallShrimp,
As you know, a high memory problem may have many different reasons. Do you think it's related to ABP framework? If so, why do you think that? Can you share more information?
Actually, we are using ABP in our projects and had no such a memory (memory leak) problem. For example, our aspnetzero.com demo web site is not resetting for months and it's using 200-300 MB of RAM.
 hikalkan
on 28 Dec 2016
hikalkan
on 28 Dec 2016
I use the abp zero template and I buy.when i login the admin system and the memory is always above 1G!
SmallShrimp
on 29 Dec 2016
Have you published it to IIS or debugging on VS? Also, does it get time to reach to 1GB or immediately?
hikalkan
on 29 Dec 2016
What does profiling with https://www.jetbrains.com/dotmemory/ reveal?
 natiki
on 7 Jan 2017
natiki
on 7 Jan 2017

SmallShrimp
on 10 Jan 2017
@SmallShrimp Have you published it to IIS or debugging on VS?
hikalkan
on 10 Jan 2017
@SmallShrimp You now need to drill down and see which objects are allocating the memory. Be sure to dig down to determine whether they are ABP, MS or your own.
natiki
on 10 Jan 2017
@hikalkan Yes! I published it to IIS.
SmallShrimp
on 10 Jan 2017
OK. As @natiki noticed, you should understand the reason of this memory problem. If it's related to ABP framework, we would be glad to solve this.
hikalkan
on 10 Jan 2017
@hikalkan : Unfortunately, I have the same problem. Here is the sequence of my test and the associated metrics.
- Launching "SampleTaskSystem-Core" solution in Build mode under Visual Studio 2015 / IIS Express.
- The task list appears. (2 tasks are in bdd). I take a memory snapshot (see attached image)
- I select the "Completed task" filter. Memory SnapShot 2 (+223,77 KB)
- I select the "Opened task" filter. Memory SnapShot 3 (+20,92 KB)
- I select the "Completed task" filter. Memory SnapShot 4 (+20,99 KB)
The memory grow up as this as each HttpRequest and the GC does not seem to release these objects in memory. By repeating the tests I arrive at more than 1 GB of ram used.
When i compare SnapShot 4 with SnapShot 3, i see many Abp Object added in ram as show in attached image.
I hope this can help solve this problem.

!
 JbmOnGitHub
on 20 Mar 2017
JbmOnGitHub
on 20 Mar 2017
We will try to repeat it.
What I can say initially is that UnitOfWorkManager is already Singleton, so I could not understand why it has multiple instances. Anyway, we will see it. Thanks.
hikalkan
on 20 Mar 2017
Fixing my last comment. UnitOfWorkManager is transient.
hikalkan
on 20 Mar 2017
@hikalkan I think this is related to the event handler leaks I fixed here. https://github.com/aspnetboilerplate/aspnetboilerplate/pull/1944
But I'm not sure if this is the entirety of the problem. We are having issues with a dotnet core Website running on IIS + Kestrel. We have noticed that the memory keeps growing and have to reboot the site multiple times a day. The site is under fairly decent load (10-15 requests a sec). We are finding that memory consumption keeps growing almost as if GC is never running. It will grow to 6Gbs + and eventually the process will crash if we don't reboot in time.
Once I fixed the above leak, Dotmemory doesn't show any more serious red flags so we are out of ideas.
One thing we thought about is that all the Controllers in the project inherit from "AbpController" which is a ITransientDependency. If these are getting registered as Transient, when are they getting released from Castle? Its my understanding that when registering as a Transient, you need to explicitly call Release on the object so Castle can dispose it and it can be handled by the GC.
Shouldn't these be registered as PerWebRequest?
Edit:
Upon further research I think my PR fixes a symptom of a deeper issue so it probably isn't useful. I went ahead and closed it and will continue looking into it.
 nhart12
on 21 Mar 2017
nhart12
on 21 Mar 2017
@hikalkan I had some more time to look into this. From what I can see it definitely looks like its leaking in the iOC container. Castle seems to hold on to resources (especially the uow classes) and it looks like it only does it when using a Castle.Proxy on a class. I'm having a hard time figuring anything else beyond this. Is there any ETA on when you can help with this? I don't mind contributing but I'm out of my depth.
For now we had to do a hack and registered a singleton in the application that Garbage collects like crazy on an interval which seems to help alleviate the memory consumption a bit.
nhart12
on 23 Mar 2017
Hi,
We will work on this in the next week. First, we will try to reproduce problem. If you have any other information that helps us to reproduce it, please share.
Thanks.
hikalkan
on 23 Mar 2017
I've just been running the project and profiling with either Ants or Dotmemory. Its pretty straight forward to reproduce. After running for even 30 seconds you can see it allocates tons of instances of the UnitOfWorkInterceptor which has a reference to the UnitOfWorkManager which has a reference to CurrentCallContextUnitOfWorkProvider. These classes are the easiest thing to use to see the leak, although it appears to be leaking others as well.
nhart12
on 23 Mar 2017
@nhart12 : so it's not limited to the "SampleTaskSystem-Core"... :/
JbmOnGitHub
on 31 Mar 2017
I attached a video which shows the leak without doing anything other than a refresh. I eliminated the code for EntityFramework and commented out logging in startup to eliminate the issues of logging and EF from being part of the cause.
The video is .SWF, you can watch it in IE (just allow blocked content).
Basically, run the project, hit refresh repeatedly. When you stop, the memory does not increase (but does not release either). Hitting refresh again causes memory to get used up again.
 amenkes
on 2 Apr 2017
amenkes
on 2 Apr 2017
Hi,
Hitting F5 will increase memory in every application; This may be because GC does not collect objects after each request. For a realistic information, we should make a long term requests. We will do that to see it.
BTW, we are using ABP in our products and hosting under IIS, and haven't seen a constantly increasing memory. It generally stabilizes at 200-300MB RAM usage for for aspnetboilerplate.com and aspnetzero.com.
hikalkan
on 2 Apr 2017
Well, except that it should GC at some point. I stop and wait, and nothing. Besides, see attached.


While AbpMemoryCache sits fine at 3, and HomeController stays at 1, TasksController has 70 instances tracked and not released.
amenkes
on 3 Apr 2017
Thank you for additional information.
hikalkan
on 3 Apr 2017
Good news! Under IIS (and not iis express), no memory leak. 👍
@amenkes, @nhart12 : I assume that, like me, your tests were performed under iis express previously?
JbmOnGitHub
on 3 Apr 2017
@JbmOnGitHub No, we are experience a leak in a Production IIS environment under heavy load
nhart12
on 3 Apr 2017
@JbmOnGitHub Although the 'leak' is present in IIS express, we're finding that the solution working in production is substantially worse. What version of IIS were you using where you did not experience any leak at all?
 MrMiracle
on 3 Apr 2017
MrMiracle
on 3 Apr 2017
@hikalkan The version of ABP you use in your products, is it the dotnet core version? We experimented briefly and noticed only core gave us the pattern of 'leaking' that we're seeing. (At least it didn't appear at first glance).
MrMiracle
on 3 Apr 2017
@MrMiracle We use IIS 10.0.14393.0 and our app is based on the "SampleTaskSystem-Core".
We modified it using postgresql instead of sqlserver and we added some features.
I simulated (3 times) up to 100 users (see attachment details) and the process keep around 350 MB.
Of course, this stress test is only valid for our specific use case....
JbmOnGitHub
on 3 Apr 2017
We're running our site on 8.5.9600.16384. We're running everything through SQL Server 2016 version 13.0.1601.5 (x64) for persistence with Abp.EntityFramework 1.5.1 to access it all. I'm wondering if there is something to that difference, maybe therein lies the issue? We were able to reproduce the pattern of the leak (although not in large amounts of data) in just a bare Abp project. In our production application, It looks like each request is loading up all the bits and pieces it needs to serve its functionality for the request, and none of the pieces get cleaned up at request's end. Then the container recreates everything at the next request and so on ad nauseam. So if a controller is resource heavy or uses a lot of repositories, etc., this causes a larger and more noticeable jump in the memory allocation and said allocation is never reclaimed.
MrMiracle
on 3 Apr 2017
I suppose it's releated to https://github.com/volosoft/castle-windsor-ms-adapter/issues/10
I released a preview nuget package: https://www.nuget.org/packages/Castle.Windsor.MsDependencyInjection/2.0.0-preview2
Can you try to see if it fixes the problem? I'm still testing.
hikalkan
on 8 Apr 2017
Oh, you may not try it since it requires some initialization change which you can not make. I will work on a bit more, sorry.
hikalkan
on 8 Apr 2017
@hikalkan glad you were able to figure it out. Let me know if you need us to test anything. @MrMiracle is available as well
nhart12
on 8 Apr 2017
Thank you. I will want tests when it's available.
hikalkan
on 8 Apr 2017
You can try this if you have time: https://www.nuget.org/packages/Castle.Windsor.MsDependencyInjection/2.0.0-preview3
hikalkan
on 8 Apr 2017
Just published ABP v2.0.0-preview3.
I tested with JMeter with thousands of requests in 60 threads parallel and see in dotMemory that this issue is fixed.
The main problem was: https://github.com/volosoft/castle-windsor-ms-adapter/issues/10
There was also a second problem (https://github.com/aspnetboilerplate/aspnetboilerplate/issues/2007) which has relatively small impact.
hikalkan
on 9 Apr 2017
Anyone tried? In our tests, memory leak problem is resolved with 2.0.0-preview4 release.
I'm closing this issue with 2.0 milestone. You can re-open if you have problems after v2.0 release (which will probably be released in the next week).
hikalkan
on 12 Apr 2017
@hikalkan We are running preview 4 now. Memory seems to have stabilized! We will continue monitoring it closely for the next few days but it looks to be resolved. Thanks!
nhart12
on 12 Apr 2017
Thanks a lot. I'm glad that it's fixed.
hikalkan
on 13 Apr 2017
I still experience the memory leak.
I updated all Abp libs from 1.5.1 to 2.1.3 and I see no changes. After some time of usage IIS process hits the 32 bit process limit. The last lines of !dumpheap -stat in windbg look like this:
10be9444   826814     48161816 Castle.MicroKernel.Burden[]
10be177c  4082411     48988932 Abp.EntityFramework.Uow.UnitOfWorkDbContextProvider`1[[Abp.Zero.EntityFramework.AbpZeroCommonDbContext`2[[MyProj.Authorization.Roles.Role, MyProj.Core],[MyProj.Authorization.Users.User, MyProj.Core]], Abp.Zero.EntityFramework]]
10ee5bd4  1395353     50232708 Castle.MicroKernel.Burden
1035d0bc  1963677     70692372 <Unloaded Type>
019882e8  6562814     78753768 Abp.EntityFramework.Uow.UnitOfWorkDbContextProvider`1[[Abp.Zero.EntityFramework.AbpZeroDbContext`3[[MyProj.MultiTenancy.Tenant, MyProj.Core],[MyProj.Authorization.Roles.Role, MyProj.Core],[MyProj.Authorization.Users.User, MyProj.Core]], Abp.Zero.EntityFramework]]
117f3ae8 16174540    194094480 Abp.Domain.Uow.UnitOfWorkInterceptor
0198835c 16174541    263960204 Castle.DynamicProxy.IInterceptor[]
11887f78 33175898    398110776 Abp.Domain.Uow.CallContextCurrentUnitOfWorkProvider
11888b08 20877047    417540940 Abp.Domain.Uow.UnitOfWorkManager
111604e4 35397996    707959920 MyProj.Web.Logging.BSCLog4NetLogger
Castle.Windsor version is 3.4.0
That's IIS, not IIS express. And not .net Core version
 andreydil
on 6 Jul 2017
andreydil
on 6 Jul 2017
@hikalkan any ideas?
andreydil
on 7 Jul 2017
@andreydil Have you updated https://www.nuget.org/packages/Castle.Windsor.MsDependencyInjection/ nuget package as well ?
 ismcagdas
on 7 Jul 2017
ismcagdas
on 7 Jul 2017
I don't have that package installed and never had. The solution was created using ASP.NET Zero
andreydil
on 7 Jul 2017
Do you use ASP.NET Core version or ASP.NET MVC 5.x ?
ismcagdas
on 7 Jul 2017
ASP.NET MVC 5.x
andreydil
on 7 Jul 2017
This fix was related to ASP.NET Core version.
Your problem is probably something different.
Have you investigated your problem with a third party tool ?
ismcagdas
on 7 Jul 2017
Investigated with windbg, as I mentioned above
andreydil
on 7 Jul 2017
@andreydil What does profiling with https://www.jetbrains.com/dotmemory/ reveal?
natiki
on 7 Jul 2017
@natiki dotMemory shows almost the same:
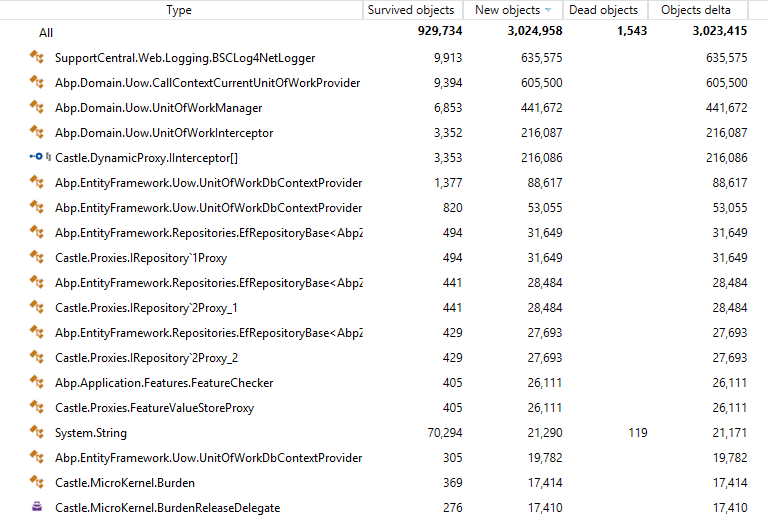
Not sure what table/diagram you want to see, so here is the full workspace (zip 270MB) https://www.dropbox.com/s/r5dr65w0ip65txv/memLeak.zip?dl=0
This time it worked much less hours, so the numbers are lower.
andreydil
on 8 Jul 2017
@andreydil And the above is just from regular requests to your application? Nothing "special" happening so just typical HTTP request, retrieve some data from the database and display it?
natiki
on 9 Jul 2017
Yes. It's after a few hundred api requests that are just CRUD.
andreydil
on 9 Jul 2017
So there are reads and writes.
@natiki what would you recommend to investigate?
andreydil
on 10 Jul 2017
@andreydil my read of the above is that you have some UoW that are not being released. As they are supposed to be transient I would expect to see nothing in the heap. So if possible can you restrict this to only reads and see if that makes a difference? And can you post some code so we can have a look at what you are doing?
natiki
on 10 Jul 2017
@andreydil, Do you have any dependency manually resolved ? Maybe, you forgot to release them, is that possible ?
ismcagdas
on 10 Jul 2017
@ismcagdas I have manually resolved dependencied, I'll check for not released, thanks.
andreydil
on 10 Jul 2017
@andreydil IocManager.ResolveAsDisposable<> or similair.
natiki
on 10 Jul 2017
Related issues
 mohammad-shadmehr
·
37Comments
mohammad-shadmehr
·
37Comments
 sylfree9999
·
37Comments
sylfree9999
·
37Comments
 ahmedhassieb
·
26Comments
ahmedhassieb
·
26Comments
 vitorlacerda
·
28Comments
vitorlacerda
·
28Comments
 beriniwlew
·
31Comments
beriniwlew
·
31Comments
Most helpful comment
@hikalkan I think this is related to the event handler leaks I fixed here. https://github.com/aspnetboilerplate/aspnetboilerplate/pull/1944
But I'm not sure if this is the entirety of the problem. We are having issues with a dotnet core Website running on IIS + Kestrel. We have noticed that the memory keeps growing and have to reboot the site multiple times a day. The site is under fairly decent load (10-15 requests a sec). We are finding that memory consumption keeps growing almost as if GC is never running. It will grow to 6Gbs + and eventually the process will crash if we don't reboot in time.
Once I fixed the above leak, Dotmemory doesn't show any more serious red flags so we are out of ideas.
One thing we thought about is that all the Controllers in the project inherit from "AbpController" which is a ITransientDependency. If these are getting registered as Transient, when are they getting released from Castle? Its my understanding that when registering as a Transient, you need to explicitly call Release on the object so Castle can dispose it and it can be handled by the GC.
Shouldn't these be registered as PerWebRequest?
Edit:
Upon further research I think my PR fixes a symptom of a deeper issue so it probably isn't useful. I went ahead and closed it and will continue looking into it.