Arviz: Plot posterior gives anomalous results for small values
Describe the bug
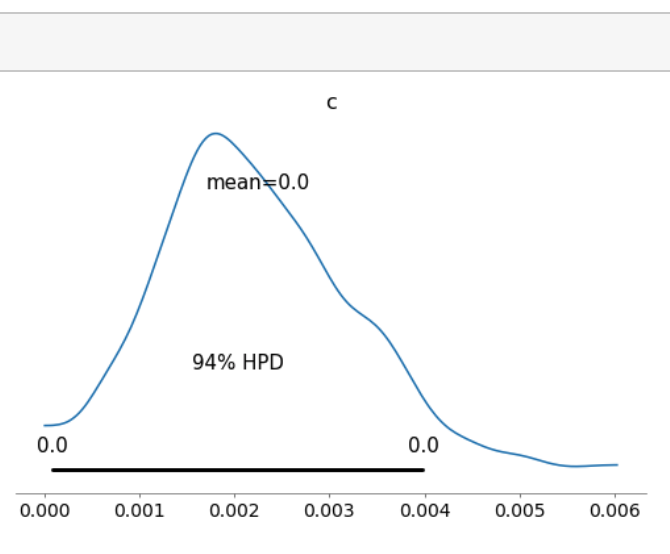
I have a model with a small parameter, and on plot posterior the variable is displayed (incorrectly) as having a mean of "0.0" and an HPD between 0.0 and 0.0.
Here's a snippet of the picture:
To Reproduce
Attached a Jupyter notebook sufficient to reproduce the issue (had to attach it as a .txt file, but should simply be rename-able to run).
Expected behavior
Expected the values displayed to be scaled appropriately.
Additional context
arviz version 0.3.3
MacOS Mojave
 rpgoldman
All 9 comments
Hi @rpgoldman. By default plot_posterior will round the point_estimate and HPD bounds to the first decimal point. You can change that using the round_to argument.
 aloctavodia
on 18 May 2019
aloctavodia
on 18 May 2019
Should we add some rules there? Like if values are less than x use scientific notation?
 ahartikainen
on 18 May 2019
ahartikainen
on 18 May 2019
@aloctavodia Is this something that could be controlled somehow using the dims?
The documentation on dims in xarray is very sparse. The dims somehow are always a list of discrete values, and there's little guidance about what that will mean when the variable with the dimension is continuous. Should we be controlling the default plotting of our variables by putting ranges on these dimensions? If so, would that solve this problem?
rpgoldman
on 22 May 2019
@aloctavodia One more, if you don't mind -- if we are plotting a number of variables using plot_posterior, and they are on different scales, how should we be using round_to? It seems like it is applied uniformly across all subplots, yes?
rpgoldman
on 22 May 2019
@ahartikainen
Should we add some rules there? Like if values are less than x use scientific notation?
Could this be done by comparing the min and max computed for the HPD, and choosing a scale accordingly?
rpgoldman
on 22 May 2019
Should we add some rules there? Like if values are less than x use scientific notation?
What about allowing a custom format string? We could change the hpd[0].round(round_to) to format_str.format(hpd[0]) if format_string is present, otherwise, the round_to argument would be used. It could also allow the option of using a list instead of a string to use different format for every plot.
 OriolAbril
on 22 May 2019
OriolAbril
on 22 May 2019
@aloctavodia One more, if you don't mind -- if we are plotting a number of variables using
plot_posterior, and they are on different scales, how should we be usinground_to? It seems like it is applied uniformly across all subplots, yes?
Yes, round_to must be an integer, and this same value is used in all plots.
OriolAbril
on 22 May 2019
Should we use significant digits instead of rounding?
rpgoldman
on 13 Jun 2019
@aloctavodia or @rpgoldman
Is this still an issue?
 canyon289
on 3 Oct 2019
canyon289
on 3 Oct 2019
Related issues
 fbartolic
·
3Comments
canyon289
·
6Comments
canyon289
·
3Comments
fbartolic
·
3Comments
canyon289
·
6Comments
canyon289
·
3Comments
 lucianopaz
·
6Comments
lucianopaz
·
6Comments
 oscarbranson
·
6Comments
oscarbranson
·
6Comments