Argo: v2.11: workflow-controller-configmap parallelism not being honored.
Summary
I set the "across workflow parallelism" in workflow-controller-config to 5.
apiVersion: v1
data:
  config: |
    parallelism: 5
    nodeEvents:
      enabled: true
    workflowDefaults:
      spec:
        ttlStrategy:
          secondsAfterSuccess: 5
        parallelism: 5
kind: ConfigMap
Then submitted 10 workflows at once and all of them went into running state
abmallic@MININT-8H2H4GR:~/argo/argo_workflows$ kg workflow
NAME STATUS AGE
dag-diamon-coinflip-5c55t Running 7s
dag-diamon-coinflip-fczh5 Running 13s
dag-diamon-coinflip-hr4k7 Running 8s
dag-diamon-coinflip-m46cv Running 11s
dag-diamon-coinflip-mq4rl Running 10s
dag-diamon-coinflip-rx2nv Running 12s
dag-diamon-coinflip-vcx66 Running 12s
dag-diamon-coinflip-wkf6r Running 6s
dag-diamon-coinflip-xvjpj Running 6s
dag-diamon-coinflip-zsmqs Running 9s
What happened/what you expected to happen?
5 of them should have gone into running state
Diagnostics
What version of Argo Workflows are you running?
2.11
```apiVersion: argoproj.io/v1alpha1
kind: Workflow
metadata:
creationTimestamp: "2020-09-21T08:28:24Z"
generateName: dag-diamon-coinflip-
generation: 4
labels:
workflows.argoproj.io/phase: Running
managedFields:
- apiVersion: argoproj.io/v1alpha1
fieldsType: FieldsV1
fieldsV1:
f:metadata:
f:generateName: {}
f:spec:
.: {}
f:arguments: {}
f:entrypoint: {}
f:podGC:
.: {}
f:strategy: {}
f:templates: {}
f:status:
.: {}
f:finishedAt: {}
manager: argo
operation: Update
time: "2020-09-21T08:28:24Z" - apiVersion: argoproj.io/v1alpha1
fieldsType: FieldsV1
fieldsV1:
f:metadata:
f:labels:
.: {}
f:workflows.argoproj.io/phase: {}
f:spec:
f:parallelism: {}
f:ttlStrategy:
.: {}
f:secondsAfterSuccess: {}
f:status:
f:nodes:
.: {}
f:dag-diamon-coinflip-5c55t:
.: {}
f:children: {}
f:displayName: {}
f:finishedAt: {}
f:id: {}
f:name: {}
f:phase: {}
f:startedAt: {}
f:templateName: {}
f:templateScope: {}
f:type: {}
f:dag-diamon-coinflip-5c55t-758823825:
.: {}
f:boundaryID: {}
f:children: {}
f:displayName: {}
f:finishedAt: {}
f:id: {}
f:name: {}
f:phase: {}
f:startedAt: {}
f:templateName: {}
f:templateScope: {}
f:type: {}
f:dag-diamon-coinflip-5c55t-2710044213:
.: {}
f:boundaryID: {}
f:children: {}
f:displayName: {}
f:finishedAt: {}
f:id: {}
f:name: {}
f:phase: {}
f:startedAt: {}
f:templateName: {}
f:templateScope: {}
f:type: {}
f:dag-diamon-coinflip-5c55t-3805981268:
.: {}
f:boundaryID: {}
f:displayName: {}
f:finishedAt: {}
f:hostNodeName: {}
f:id: {}
f:name: {}
f:phase: {}
f:startedAt: {}
f:templateName: {}
f:templateScope: {}
f:type: {}
f:phase: {}
f:startedAt: {}
manager: workflow-controller
operation: Update
time: "2020-09-21T08:28:28Z"
name: dag-diamon-coinflip-5c55t
namespace: argo
resourceVersion: "2958114"
selfLink: /apis/argoproj.io/v1alpha1/namespaces/argo/workflows/dag-diamon-coinflip-5c55t
uid: 12cb8123-a6be-4676-8902-b8b6b4fdc0cc
spec:
arguments: {}
entrypoint: diamond
parallelism: 5
podGC:
strategy: OnWorkflowSuccess
templates: - arguments: {}
dag:
tasks:
- arguments: {}
name: A
template: coinflip - arguments: {}
dependencies:
- A
name: B
template: coinflip
- A
- arguments: {}
dependencies:
- A
name: C
template: coinflip
- A
- arguments: {}
dependencies:
- B
- C
name: D
template: coinflip
inputs: {}
metadata: {}
name: diamond
nodeSelector:
agentpool: argoworkload
outputs: {}
- arguments: {}
- arguments: {}
inputs: {}
metadata: {}
name: coinflip
nodeSelector:
agentpool: argoworkload
outputs: {}
steps:
- - arguments: {}
name: flip-coin
template: flip-coin
- - arguments: {}
name: heads
template: found-heads
when: '{{steps.flip-coin.outputs.result}} == heads'
- arguments: {}
name: tails
template: coinflip
when: '{{steps.flip-coin.outputs.result}} == tails'
- arguments: {}
- arguments: {}
inputs: {}
metadata: {}
name: flip-coin
nodeSelector:
agentpool: argoworkload
outputs: {}
script:
command:
- python
image: python:alpine3.6
name: ""
resources: {}
source: |
import random
import time
time.sleep(60)
result = "heads" if random.randint(0,1) == 0 else "tails"
print(result)
- python
- arguments: {}
container:
args:
- echo "it was heads"
command: - sh
- -c
image: alpine:3.6
name: ""
resources: {}
inputs: {}
metadata: {}
name: found-heads
nodeSelector:
agentpool: argoworkload
outputs: {}
ttlStrategy:
secondsAfterSuccess: 5
status:
finishedAt: null
nodes:
dag-diamon-coinflip-5c55t:
children: - dag-diamon-coinflip-5c55t-758823825
displayName: dag-diamon-coinflip-5c55t
finishedAt: null
id: dag-diamon-coinflip-5c55t
name: dag-diamon-coinflip-5c55t
phase: Running
startedAt: "2020-09-21T08:28:24Z"
templateName: diamond
templateScope: local/dag-diamon-coinflip-5c55t
type: DAG
dag-diamon-coinflip-5c55t-758823825:
boundaryID: dag-diamon-coinflip-5c55t
children: - dag-diamon-coinflip-5c55t-2710044213
displayName: A
finishedAt: null
id: dag-diamon-coinflip-5c55t-758823825
name: dag-diamon-coinflip-5c55t.A
phase: Running
startedAt: "2020-09-21T08:28:24Z"
templateName: coinflip
templateScope: local/dag-diamon-coinflip-5c55t
type: Steps
dag-diamon-coinflip-5c55t-2710044213:
boundaryID: dag-diamon-coinflip-5c55t-758823825
children: - dag-diamon-coinflip-5c55t-3805981268
displayName: '[0]'
finishedAt: null
id: dag-diamon-coinflip-5c55t-2710044213
name: dag-diamon-coinflip-5c55t.A[0]
phase: Running
startedAt: "2020-09-21T08:28:24Z"
templateName: coinflip
templateScope: local/dag-diamon-coinflip-5c55t
type: StepGroup
dag-diamon-coinflip-5c55t-3805981268:
boundaryID: dag-diamon-coinflip-5c55t-758823825
displayName: flip-coin
finishedAt: null
hostNodeName: aks-argoworkload-29252569-vmss00001o
id: dag-diamon-coinflip-5c55t-3805981268
name: dag-diamon-coinflip-5c55t.A[0].flip-coin
phase: Running
startedAt: "2020-09-21T08:28:24Z"
templateName: flip-coin
templateScope: local/dag-diamon-coinflip-5c55t
type: Pod
phase: Running
startedAt: "2020-09-21T08:28:24Z"
- echo "it was heads"
```
Message from the maintainers:
Impacted by this bug? Give it a 👍. We prioritise the issues with the most 👍.
 AbhishekMallick
All 25 comments
Can you provide workflow-controller log?
Kubectl logs
 sarabala1979
on 21 Sep 2020
sarabala1979
on 21 Sep 2020
I have been tracking down ttlStrategy & serviceAccount also not being honored either on the workflowDefaults. Perhaps this goes further than just parallelism? Although this appears to be intermittent and/or workflow dependent.
Workflow Controller Logs for Failing to apply workflowDefaults.psec.serviceAccountName
time="2020-09-21T14:52:59Z" level=info msg="Processing workflow" namespace=sandbox workflow=steps-zjxns
time="2020-09-21T14:52:59Z" level=info msg="Updated phase  -> Running" namespace=sandbox workflow=steps-zjxns
time="2020-09-21T14:52:59Z" level=info msg="Steps node steps-zjxns initialized Running" namespace=sandbox workflow=steps-zjxns
time="2020-09-21T14:52:59Z" level=info msg="StepGroup node steps-zjxns-3343772756 initialized Running" namespace=sandbox workflow=steps-zjxns
time="2020-09-21T14:52:59Z" level=info msg="Pod node steps-zjxns-3740556429 initialized Pending" namespace=sandbox workflow=steps-zjxns
time="2020-09-21T14:52:59Z" level=info msg="Created pod: steps-zjxns[0].hello1 (steps-zjxns-3740556429)" namespace=sandbox workflow=steps-zjxns
time="2020-09-21T14:52:59Z" level=info msg="Workflow step group node steps-zjxns-3343772756 not yet completed" namespace=sandbox workflow=steps-zjxns
time="2020-09-21T14:52:59Z" level=info msg="Workflow update successful" namespace=sandbox phase=Running resourceVersion=2251432 workflow=steps-zjxns
time="2020-09-21T14:53:00Z" level=info msg="Processing workflow" namespace=sandbox workflow=steps-zjxns
time="2020-09-21T14:53:00Z" level=info msg="Updating node steps-zjxns-3740556429 message: ContainerCreating"
time="2020-09-21T14:53:00Z" level=info msg="Skipped pod steps-zjxns[0].hello1 (steps-zjxns-3740556429) creation: already exists" namespace=sandbox podPhase=Pending workflow=steps-zjxns
time="2020-09-21T14:53:00Z" level=info msg="Workflow step group node steps-zjxns-3343772756 not yet completed" namespace=sandbox workflow=steps-zjxns
time="2020-09-21T14:53:00Z" level=info msg="Workflow update successful" namespace=sandbox phase=Running resourceVersion=2251441 workflow=steps-zjxns
time="2020-09-21T14:53:01Z" level=info msg="Processing workflow" namespace=sandbox workflow=steps-zjxns
time="2020-09-21T14:53:01Z" level=info msg="Skipped pod steps-zjxns[0].hello1 (steps-zjxns-3740556429) creation: already exists" namespace=sandbox podPhase=Pending workflow=steps-zjxns
time="2020-09-21T14:53:01Z" level=info msg="Workflow step group node steps-zjxns-3343772756 not yet completed" namespace=sandbox workflow=steps-zjxns
time="2020-09-21T14:53:03Z" level=info msg="Processing workflow" namespace=sandbox workflow=steps-zjxns
time="2020-09-21T14:53:03Z" level=info msg="Updating node steps-zjxns-3740556429 status Pending -> Running"
time="2020-09-21T14:53:03Z" level=info msg="Workflow step group node steps-zjxns-3343772756 not yet completed" namespace=sandbox workflow=steps-zjxns
time="2020-09-21T14:53:03Z" level=info msg="Workflow update successful" namespace=sandbox phase=Running resourceVersion=2251459 workflow=steps-zjxns
time="2020-09-21T14:53:04Z" level=info msg="Processing workflow" namespace=sandbox workflow=steps-zjxns
time="2020-09-21T14:53:04Z" level=info msg="Workflow step group node steps-zjxns-3343772756 not yet completed" namespace=sandbox workflow=steps-zjxns
time="2020-09-21T14:53:09Z" level=info msg="Processing workflow" namespace=sandbox workflow=steps-zjxns
time="2020-09-21T14:53:09Z" level=info msg="Updating node steps-zjxns-3740556429 status Running -> Error"
time="2020-09-21T14:53:09Z" level=info msg="Updating node steps-zjxns-3740556429 message: failed to save outputs: Failed to establish pod watch: timed out waiting for the condition"
time="2020-09-21T14:53:09Z" level=info msg="Step group node steps-zjxns-3343772756 deemed failed: child 'steps-zjxns-3740556429' failed" namespace=sandbox workflow=steps-zjxns
time="2020-09-21T14:53:09Z" level=info msg="node steps-zjxns-3343772756 phase Running -> Failed" namespace=sandbox workflow=steps-zjxns
time="2020-09-21T14:53:09Z" level=info msg="node steps-zjxns-3343772756 message: child 'steps-zjxns-3740556429' failed" namespace=sandbox workflow=steps-zjxns
time="2020-09-21T14:53:09Z" level=info msg="node steps-zjxns-3343772756 finished: 2020-09-21 14:53:09.334926131 +0000 UTC" namespace=sandbox workflow=steps-zjxns
time="2020-09-21T14:53:09Z" level=info msg="step group steps-zjxns-3343772756 was unsuccessful: child 'steps-zjxns-3740556429' failed" namespace=sandbox workflow=steps-zjxns
time="2020-09-21T14:53:09Z" level=info msg="Outbound nodes of steps-zjxns-3740556429 is [steps-zjxns-3740556429]" namespace=sandbox workflow=steps-zjxns
time="2020-09-21T14:53:09Z" level=info msg="Outbound nodes of steps-zjxns is [steps-zjxns-3740556429]" namespace=sandbox workflow=steps-zjxns
time="2020-09-21T14:53:09Z" level=info msg="node steps-zjxns phase Running -> Failed" namespace=sandbox workflow=steps-zjxns
time="2020-09-21T14:53:09Z" level=info msg="node steps-zjxns message: child 'steps-zjxns-3740556429' failed" namespace=sandbox workflow=steps-zjxns
time="2020-09-21T14:53:09Z" level=info msg="node steps-zjxns finished: 2020-09-21 14:53:09.335050744 +0000 UTC" namespace=sandbox workflow=steps-zjxns
time="2020-09-21T14:53:09Z" level=info msg="Checking daemoned children of steps-zjxns" namespace=sandbox workflow=steps-zjxns
time="2020-09-21T14:53:09Z" level=info msg="Updated phase Running -> Failed" namespace=sandbox workflow=steps-zjxns
time="2020-09-21T14:53:09Z" level=info msg="Updated message  -> child 'steps-zjxns-3740556429' failed" namespace=sandbox workflow=steps-zjxns
time="2020-09-21T14:53:09Z" level=info msg="Marking workflow completed" namespace=sandbox workflow=steps-zjxns
time="2020-09-21T14:53:09Z" level=info msg="Checking daemoned children of " namespace=sandbox workflow=steps-zjxns
time="2020-09-21T14:53:09Z" level=info msg="Workflow update successful" namespace=sandbox phase=Failed resourceVersion=2251485 workflow=steps-zjxns
time="2020-09-21T14:53:10Z" level=info msg="Labeled pod completed" namespace=sandbox pod=steps-zjxns-3740556429
 willgleich
on 21 Sep 2020
willgleich
on 21 Sep 2020
Related to #4044
 alexec
on 21 Sep 2020
alexec
on 21 Sep 2020
@sarabala1979 do you want to own?
alexec
on 21 Sep 2020
Workflow controller logs @sarabala1979
workflow_controller.log
AbhishekMallick
on 21 Sep 2020
I have been tracking down ttlStrategy & serviceAccount also not being honored either on the workflowDefaults. Perhaps this goes further than just parallelism? Although this appears to be intermittent and/or workflow dependent.
Workflow Controller Logs for Failing to apply workflowDefaults.psec.serviceAccountName
ttlStrategy however seems to be working fine.
AbhishekMallick
on 21 Sep 2020
Okay .. update. I deleted workflow-controller deployment and re-deployed argo. It created workflow-controller again. Also, deleted the couple of pods for the workflow-controller and argo-server. Left the configmap as is. Submitted 10 workflows again. But this time, only 7 workflows ran at a time. So there was some throttling.
Are there steps to be done post the config map updates. That's something that might have been missing.
@willgleich @sarabala1979
AbhishekMallick
on 21 Sep 2020
@AbhishekMallick Above workflow log doesn't have any parallelism logs. it looks like controller is not seeing configmap update
Here the checklist
- Update the Parallelism on
workflow-controller-confimapin argo namespace - Once you updated confimap, you can see the updated configmap in workflow-controler log
- you should see the
Workflow processing has been postponed due to max parallelism limitlog message when controller reaches limit
Please provide the latest controller log with configmap update.
sarabala1979
on 21 Sep 2020
I am also facing this issue.
My Argo workflow controller config-map
apiVersion: v1
data:
  # More configs here https://github.com/argoproj/argo/blob/master/docs/workflow-controller-configmap.yaml
  config: |
        parallelism: 100
        nodeEvents:
            enabled: false
        workflowDefaults:
          spec:
            ttlStrategy:
              secondsAfterSuccess: 3600
            parallelism: 20
kind: ConfigMap
metadata:
  name: workflow-controller-configmap
Argo controller logs
workflow-controller-5d956bfb6d-d74t2.log
Graphana metrics
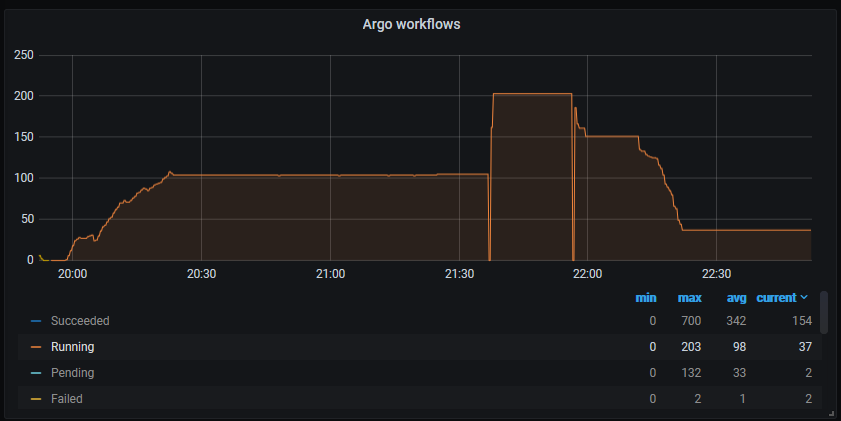
I can see that it is respecting this limit for while but after some time it is not honoring the parallelism limit.
Sample workflow logs
time="2020-09-21T16:46:34Z" level=warning msg="Workflow processing has been postponed due to max parallelism limit" key=argo/internal-data-ingestioncs7nk
time="2020-09-21T16:46:43Z" level=warning msg="Workflow processing has been postponed due to max parallelism limit" key=argo/internal-data-ingestiongbt7k
time="2020-09-21T16:46:43Z" level=warning msg="Workflow processing has been postponed due to max parallelism limit" key=argo/internal-data-ingestioncbzcd
time="2020-09-21T16:46:48Z" level=warning msg="Workflow processing has been postponed due to max parallelism limit" key=argo/internal-data-ingestionmwf7b
time="2020-09-21T16:46:48Z" level=warning msg="Workflow processing has been postponed due to max parallelism limit" key=argo/internal-data-ingestioncs7nk
Suggestion
It will better if you can improve logging message with additional information like current running workflows count and configured limit in this log message to avoid confusions.
 BlackRider97
on 21 Sep 2020
BlackRider97
on 21 Sep 2020
Thanks for details information. Is it possible to get the log for 21:30 to 22:30. I want to see after dip in graph. The controller didn't honoring it. Did you install new controller or update configmap?
sarabala1979
on 21 Sep 2020
@sarabala1979, the logs are attached in his message. Under Argo Controller logs. I can see that the logs match with what both of you are saying - the parallelism limit was being honored for a while and that's there in the logs. But, then it suddenly stops happening.
AbhishekMallick
on 21 Sep 2020
There is a bug in the controller when if you change controlle-level parallelism (i.e. in the config map), we do not actually update the controller. You must restart the controller if you change the controller parallelism.
You can change the workflow-level item.
To fix this:
Copy this line: https://github.com/argoproj/argo/blob/master/workflow/controller/controller.go#L140 to here https://github.com/argoproj/argo/blob/master/workflow/controller/config.go#L34.
alexec
on 21 Sep 2020
@alexec I have noticed that bug earlier also so as precautionary step I restarted my Argo workflow controller before starting my actual workload. I confirmed that controller is picking latest config-map with parallelism=100 by looking at controller logs of config is being used. Even after restart, controller is not respecting parallelism always.
Argo controller logs
level=info msg="Configuration:\nartifactRepository: {}\nmetricsConfig: {}\nnodeEvents:\n  enabled: false\nparallelism: 100\npodSpecLogStrategy: {}\nsso:\n  clientId:\n    key: \"\"\n  clientSecret:\n    key: \
"\"\n  issuer: \"\"\n  redirectUrl: \"\"\ntelemetryConfig: {}\nworkflowDefaults:\n  metadata:\n    creationTimestamp: null\n  spec:\n    arguments: {}\n    parallelism: 20\n    ttlStrategy:\n      secondsAfterSuccess: 3600\n  status:\n
  finishedAt: null\n    startedAt: null\n"
So I suspect that restart bug you are talking about is separate then what I am facing.
BlackRider97
on 22 Sep 2020
@BlackRider97 do you like to submit the PR with a fix?
To fix this:
Copy this line: https://github.com/argoproj/argo/blob/master/workflow/controller/controller.go#L140 to here https://github.com/argoproj/argo/blob/master/workflow/controller/config.go#L34.
sarabala1979
on 28 Sep 2020
I've created a fix in #4132. If I create a dev build, could I please ask you to run it?
alexec
on 28 Sep 2020
The dev build is argoproj/workflow-controller:throttler
alexec
on 29 Sep 2020
Do you have an ETA on when this would land? We have run into this issue as well and would love to use workflow parallelism. We are running many massive workflows concurrently which runs into scalability issues w/ kubernetes, so setting workflow parallelism and pods per workflow is essential for us to prevent the system from grinding to a halt.
Our testing steps were:
- Set parallelism to 2 in configmap
- restart the workflow-controller
- launch 3 workflows -- the 3rd one was pending (expected)
- Set parallelism to 5 in configmap
- restart the workflow-controller
- launch 7 workflows -- all 7 went into the running state (expected: only 5 go into the running state).
This symptoms seem to be very similar to what others described above.
 lynxoid
on 5 Oct 2020
lynxoid
on 5 Oct 2020
Our testing steps
Are you saying that argoproj/workflow-controller:throttler did not work for you?
alexec
on 5 Oct 2020
@lynxoid I think your issue may be better solved by #4207 which is now on latest.
alexec
on 5 Oct 2020
Are you saying that
argoproj/workflow-controller:throttlerdid not work for you?
Is this a docker image? Where do I pull it from? I did not see a project w/ this name / release.
lynxoid
on 6 Oct 2020
(⎈ |k3s-default:argo)➜  argo git:(int64str) docker pull argoproj/workflow-controller:throttler
throttler: Pulling from argoproj/workflow-controller
Digest: sha256:5c65218e4c5857fe9b2bdf1954c59f630ca245ce674b9ea7965197f85f2514ec
Status: Image is up to date for argoproj/workflow-controller:throttler
docker.io/argoproj/workflow-controller:throttler
(⎈ |k3s-default:argo)➜  argo git:(int64str) docker run argoproj/workflow-controller:throttler version
workflow-controller: v2.3.0-rc3
  BuildDate: 2020-09-28T22:59:32Z
  GitCommit: 83ced5299381d7d7bab24c41879c5f110fd62b57
  GitTreeState: clean
  GitTag: v2.3.0-rc3
  GoVersion: go1.13.15
  Compiler: gc
  Platform: linux/amd64
We updated the wokrlfow-controller to use argoproj/workflow-controller:throttler. The controller restarted picking up parallelism: 3 setting. We kicked off 4 workflows: 3 went to "running" right away, 1 to "pending". All good.
Next, we edited the config and set "parallelism: 2", then kicked off 4 workflows again. Expected behavior: 2 running, 2 pending. Observed: 3 running, 1 pending -- so it seems that the update to config was not picked up. We deleted the controller pod causing it to restart and picking up the config setting. Kicked off 4 again -- 2 running, 2 pending this time. Seems that w/ this change you still need to restart the controller for changes to be picked up.
I'd like to test the issue where the limit is no longer respected after some time -- is there a faster test than what is described above by other reporters?
Next step for us is to try the 2.11.2 release since it has #4207.
lynxoid
on 6 Oct 2020
Seems that w/ this change you still need to restart the controller for changes to be picked up.
Correct. This config item is not used by many people, so I want to keep it simple to reduce bugs, and not having the ability to re-configure at runtime is part of that.
alexec
on 6 Oct 2020
@lynxoid I'm waiting for you to say the fix works for you before it getting it reviewed and merged. Did you think it works for you?
alexec
on 8 Oct 2020
This issue has been automatically closed because there has been no response to our request for more information from the original author. With only the information that is currently in the issue, we don't have enough information to take action. Please reach out if you have or find the answers we need so that we can investigate further.
![no-response[bot] picture](https://avatars2.githubusercontent.com/u/26350515?v=4&s=40) no-response[bot]
on 16 Oct 2020
no-response[bot]
on 16 Oct 2020
Related issues
 vicaire
·
4Comments
vicaire
·
4Comments
 iterion
·
3Comments
iterion
·
3Comments
 delwaterman
·
3Comments
delwaterman
·
3Comments
 ddseapy
·
3Comments
ddseapy
·
3Comments
 CermakM
·
3Comments
CermakM
·
3Comments