Argo: v2.10/v2.11/latest(21st Sep): Too many warn & error messages in Argo Workflow Controller (msg="error in entry template execution" error="Deadline exceeded")
Summary
Too many warning and error messages inside Argo workflow controllers
Argo workflow controller logs
$ kubectl logs --tail=20 workflow-controller-cb99d68cf-znssr
time="2020-09-16T13:46:45Z" level=error msg="error in entry template execution" error="Deadline exceeded" namespace=argo workflow=internal-data-ingestionczpht
time="2020-09-16T13:46:45Z" level=warning msg="Deadline exceeded" namespace=argo workflow=internal-data-ingestioncbmt6
time="2020-09-16T13:46:45Z" level=error msg="error in entry template execution" error="Deadline exceeded" namespace=argo workflow=internal-data-ingestioncbmt6
time="2020-09-16T13:46:46Z" level=warning msg="Deadline exceeded" namespace=argo workflow=internal-data-ingestionvz4km
time="2020-09-16T13:46:46Z" level=error msg="error in entry template execution" error="Deadline exceeded" namespace=argo workflow=internal-data-ingestionvz4km
time="2020-09-16T13:46:46Z" level=warning msg="Deadline exceeded" namespace=argo workflow=internal-data-ingestionhvnhs
time="2020-09-16T13:46:46Z" level=error msg="error in entry template execution" error="Deadline exceeded" namespace=argo workflow=internal-data-ingestionhvnhs
time="2020-09-16T13:46:46Z" level=warning msg="Deadline exceeded" namespace=argo workflow=internal-data-ingestionnnsbb
time="2020-09-16T13:46:46Z" level=error msg="error in entry template execution" error="Deadline exceeded" namespace=argo workflow=internal-data-ingestionnnsbb
time="2020-09-16T13:46:46Z" level=warning msg="Deadline exceeded" namespace=argo workflow=internal-data-ingestionkc5sb
time="2020-09-16T13:46:46Z" level=error msg="error in entry template execution" error="Deadline exceeded" namespace=argo workflow=internal-data-ingestionkc5sb
time="2020-09-16T13:46:46Z" level=warning msg="Deadline exceeded" namespace=argo workflow=internal-data-ingestionc9fcz
time="2020-09-16T13:46:46Z" level=error msg="error in entry template execution" error="Deadline exceeded" namespace=argo workflow=internal-data-ingestionc9fcz
time="2020-09-16T13:46:46Z" level=warning msg="Deadline exceeded" namespace=argo workflow=internal-data-ingestionpjczx
time="2020-09-16T13:46:46Z" level=error msg="error in entry template execution" error="Deadline exceeded" namespace=argo workflow=internal-data-ingestionpjczx
time="2020-09-16T13:46:46Z" level=warning msg="Deadline exceeded" namespace=argo workflow=internal-data-ingestionftmdh
time="2020-09-16T13:46:46Z" level=error msg="error in entry template execution" error="Deadline exceeded" namespace=argo workflow=internal-data-ingestionftmdh
time="2020-09-16T13:46:46Z" level=warning msg="Deadline exceeded" namespace=argo workflow=internal-data-ingestionbfrc5
time="2020-09-16T13:46:46Z" level=error msg="error in entry template execution" error="Deadline exceeded" namespace=argo workflow=internal-data-ingestionbfrc5
Workflows are getting stuck after some time and not completing in 12+ hours while normal execution is around 1 minute.
I am creating almost 1000 workflows with each workflow containing 4 Pods in short span of time. There are enough worker nodes to do processing so no issues as such from K8s cluster side.
internal-data-ingestiontj79x error in entry template execution: Deadline exceeded github.com/argoproj/argo/errors.New  /go/src/github.com/argoproj/argo/errors/errors.go:49 github.com/argoproj/argo/workflow/controller.init  /go/src/github.com/argoproj/argo/workflow/controller/operator.go:102 runtime.doInit  /usr/local/go/src/runtime/proc.go:5222 runtime.doInit  /usr/local/go/src/runtime/proc.go:5217 runtime.main  /usr/local/go/src/runtime/proc.go:190 runtime.goexit  /usr/local/go/src/runtime/asm_amd64.s:1357
--
Diagnostics
What version of Argo Workflows are you running?
Argo v2.10.1
Message from the maintainers:
Impacted by this bug? Give it a 👍. We prioritise the issues with the most 👍.
 BlackRider97
All 61 comments
Deadline exceeded message as expected for each workflow which takes more than 10 seconds for one-time processing.
The message was printing for each workflow.
How big is your workflow?
Do you have withparam or FromValue in your workflow?
 sarabala1979
on 16 Sep 2020
sarabala1979
on 16 Sep 2020
Maybe fixed by #3905.
Does the workflow have a DAG with 1000s of items?
 alexec
on 16 Sep 2020
alexec
on 16 Sep 2020
@sarabala1979 Yes we have withparam in our workflows.
I didn't understand what is meaning of 10 secs of one-time processing ?
Does this over all workflow execution time or any individual step/pod execution or something else ?
Expected means should I ignore these warns & error messages ?
@alexec No, the workflow do not have a DAG with 1000s of items. However it has DAG with about 8 items.
And there are 500+ workflows are running concurrently.
Still you suspect, it is related to fix #3905 ?
BlackRider97
on 17 Sep 2020
When deadline is exceeded it maybe possible for workflow to get corrupted, so the reconciliation aborts. Reconciliation is allowed 10s and can take longer if, for example:
- Kubernetes API request are taking a long time - e.g. due to a lot of work happening.
- There are many Kubernetes API being made- e.g. because the DAG is large.
As you are running many workflows, it is probably flooding the Kubernetes API. Have you tried limiting work in progress this, e.g. using parallelism or semaphores.
We are working on various improvements in v2.11 and v2.12 to support large scale.
alexec
on 17 Sep 2020
@alexec Yes I can see that Kubernetes API request are taking a long time during my large workload execution.
After using parallelism it solves the problem but we loose scaling & concurrent execution of workflows while sufficient worker nodes are available to do the processing.
Should I ignore these warn & error log messages ?
I can see that my workflow are getting stuck in Running state while there is no Pod which is in Running state.
$ argo list -n argo --running | wc -l
307
$ kubectl get pods -n argo
NAME                                                 READY   STATUS      RESTARTS   AGE
argo-server-57b8549fdb-hptg2                         1/1     Running     1          2d21h
workflow-controller-cb99d68cf-mc4j8                  1/1     Running     0          16h

No workflow PODS
$ kubectl describe workflow internal-data-ingestioncnmdb

  Phase:               Running
  Started At:          2020-09-18T05:39:14Z
Events:
  Type     Reason            Age   From                 Message
  ----     ------            ----  ----                 -------
  Normal   WorkflowRunning   37m   workflow-controller  Workflow Running
  Warning  WorkflowTimedOut  36m   workflow-controller  Workflow timed out
What kind of improvements you are trying to do to support large scale ?
BlackRider97
on 18 Sep 2020
I would upgrade to v2.11.0 and try with that version. I'm not sure we will have fully fixed this problem until v2.12 mind you.
alexec
on 18 Sep 2020
@alexec After upgrading to v2.11.0 also I can see these warnings and errors
time="2020-09-21T07:09:52Z" level=error msg="error in entry template execution" error="Deadline exceeded" namespace=argo workflow=internal-data-ingestion5z894
time="2020-09-21T07:10:03Z" level=warning msg="Deadline exceeded" namespace=argo workflow=internal-data-ingestion9p7qr
time="2020-09-21T07:10:03Z" level=warning msg="Deadline exceeded" namespace=argo workflow=internal-data-ingestionbrpb8
time="2020-09-21T07:10:03Z" level=error msg="error in entry template execution" error="Deadline exceeded" namespace=argo workflow=internal-data-ingestionbrpb8
time="2020-09-21T07:10:03Z" level=warning msg="Deadline exceeded" namespace=argo workflow=internal-data-ingestionckccs
time="2020-09-21T07:10:03Z" level=error msg="error in entry template execution" error="Deadline exceeded" namespace=argo workflow=internal-data-ingestionckccs
time="2020-09-21T07:10:04Z" level=warning msg="Deadline exceeded" namespace=argo workflow=internal-data-ingestiongcv4c
time="2020-09-21T07:10:04Z" level=error msg="error in entry template execution" error="Deadline exceeded" namespace=argo workflow=internal-data-ingestiongcv4c
time="2020-09-21T07:10:04Z" level=warning msg="Deadline exceeded" namespace=argo workflow=internal-data-ingestionwcx7n
time="2020-09-21T07:10:04Z" level=error msg="error in entry template execution" error="Deadline exceeded" namespace=argo workflow=internal-data-ingestionwcx7n
time="2020-09-21T07:10:14Z" level=warning msg="Deadline exceeded" namespace=argo workflow=internal-data-ingestiongcv4c
time="2020-09-21T07:10:14Z" level=error msg="error in entry template execution" error="Deadline exceeded" namespace=argo workflow=internal-data-ingestiongcv4c
This is when I started 100 concurrent workflows with each workflow having about 6-7 Pods.
BlackRider97
on 21 Sep 2020
This workflow is interesting. I got such 3 failed workflows in setup of 200 concurrent running workflows.

get-data-and-further is a DAG with 3 children of it and one pod for one DAG branch.
All 3 Pod got succeeded but overall workflow is Failed
Attached all logs related to this workflow for further debugging.
failed-ingestionrkc5f.log
Highlights of logs
time="2020-09-21T09:26:18Z" level=info msg="Step group node internal-data-ingestionrkc5f-2608704937 deemed failed: child 'internal-data-ingestionrkc5f-3985201543' failed" namespace=argo workflow=internal-data-ingestionrkc5f
time="2020-09-21T09:26:18Z" level=info msg="node internal-data-ingestionrkc5f-2608704937 phase Running -> Failed" namespace=argo workflow=internal-data-ingestionrkc5f
time="2020-09-21T09:26:18Z" level=info msg="node internal-data-ingestionrkc5f-2608704937 message: child 'internal-data-ingestionrkc5f-3985201543' failed" namespace=argo workflow=internal-data-ingestionrkc5f
time="2020-09-21T09:26:18Z" level=info msg="node internal-data-ingestionrkc5f-2608704937 finished: 2020-09-21 09:26:18.805091638 +0000 UTC" namespace=argo workflow=internal-data-ingestionrkc5f
@alexec Can you tell me meaning for Step group node internal-data-ingestionrkc5f-2608704937 deemed failed: child 'internal-data-ingestionrkc5f-3985201543' failed ? Pod is succeeded but workflow got Failed due to some other error in Argo workflow execution.
Looking at code https://github.com/argoproj/argo/blob/5be254425e3bb98850b31a2ae59f66953468d890/workflow/controller/steps.go#L279
It seems like Argo was checking for all children of a DAG for completion and got error for one of the children.
BlackRider97
on 21 Sep 2020
What I understood from my observations is that-
Due to lot of concurrent workflows there is sudden increase in no of Pods. That is resulting into K8s API server timeouts (or API failures). And due to that Argo workflow controller getting into inconsistent state.
Some workflows are in forever Pending state while controller is not picking up those at all. Some are failing randomly as Argo workflow controller is not able to commit states for workflows even though DAG task or sequentially step succeeded. Workflow controller is taking more time to process workflows due to slowness in K8s APIs.
Slowness is expected and it's fine but inconsistent state of workflows worries me a lot.
Argo should have a better handling while keeping healthy state machine for each workflow considering such network failures.
@sarabala1979 Any help here ?
BlackRider97
on 21 Sep 2020
Can anyone please provide some executable reproduction steps? I.e. can you provide a workflow that reproduces this behaviour. It is extremely time consuming (and often impractical) to fix bugs where this has not been provided.
alexec
on 21 Sep 2020
This is the line of code deeming failure:
alexec
on 21 Sep 2020
@alexec: Workflow
coin_flip.yml
apiVersion: argoproj.io/v1alpha1
kind: Workflow
metadata:
  generateName: dag-diamon-coinflip-
spec:
  podGC:
    strategy: OnWorkflowSuccess
  entrypoint: diamond
  templates:
  - name: diamond
    dag:
      tasks:
        - name: A
          template: coinflip
        - name: B
          dependencies: [A]
          template: coinflip
        - name: C
          dependencies: [A]
          template: coinflip
        - name: D
          dependencies: [B, C]
          template: coinflip

  - name: coinflip
    steps:
      - - name: flip-coin
          template: flip-coin
      - - name: heads
          template: found-heads
          when: "{{steps.flip-coin.outputs.result}} == heads"
        - name: tails
          template: coinflip
          when: "{{steps.flip-coin.outputs.result}} == tails"

  - name: flip-coin
    script:
      image: python:alpine3.6
      command: [python]
      source: |
        import random
        import time
        time.sleep(60)
        result = "heads" if random.randint(0,1) == 0 else "tails"
        print(result)

  - name: found-heads
    container:
      image: alpine:3.6
      command: [sh, -c]
      args: ["echo \"it was heads\""]
submit 1000 of them at once - load_argo.sh
./load_argo.sh coin_flip.yml 1000
load_argo.sh
#!/bin/bash
for ((i=1;i<=$2;i++));
do
        argo submit -n argo $1
done
Using an Azure kubernetes cluster.
 AbhishekMallick
on 21 Sep 2020
AbhishekMallick
on 21 Sep 2020
Do you have time for a Zoom?
alexec
on 21 Sep 2020
Hey @alexec - sure. Let me know of a time that works for you..
AbhishekMallick
on 21 Sep 2020
Hi @alexec - I am in IST time zone. I was also wondering how will we connect.. You most likely don't see my email address. I can't see yours at least. Is there someway I can message you?
AbhishekMallick
on 22 Sep 2020
I'm in PST, so we do not have overlapping working hour with IST AFAIK - so no Zoom.
alexec
on 22 Sep 2020
We'll adjust the timing at our end. Please let us know your availability or email address to have Zoom call. I'll send you an invite there. It will be very helpful if we are able to nail down to the exact issue.
BlackRider97
on 23 Sep 2020
@BlackRider97 which TZ are you in please? Could you do between 4:30pm and 6pm PST today? 9am and 10am tomorrow (Thursday)?
alexec
on 23 Sep 2020
@alexec @AbhishekMallick I am in IST (GMT+5:30) time zone.
Lets do it on Thursday, 24 September 2020 9AM PST ( Thursday, 24 September 2020 9:30 PM IST).
@alexec Please let me know how I can send you a Zoom call invite to you ?
BlackRider97
on 24 Sep 2020
I'm busy at 9am, but free at 9:30am. Find me here: https://intuit.zoom.us/j/9471219298?pwd=L3dwWklkclZNUk1VYkJBOTE0SGREdz09
alexec
on 24 Sep 2020
I'd like to understand the exact state change a broken workflow has goes through. This can be done either:
(a) using a named workflow (i.e. not metadata.name not metadata.generatedName)
kubectl apply my-wf.yaml && kubectl get --watch wf-name
I've a script that'll turn that into a sequence of JSON patches that show the exact changes.
(b) enabling detailed logging on the workflow controller:
--logelevel=debug --gloglevel=0
That'll log each message sent to Kubernetes. Would that be possible please?
alexec
on 24 Sep 2020
@BlackRider97 @AbhishekMallick, I've started work to fix the throttling issue, but the invalid state issue is a much bigger concern.
I'd like to discount this being a problem caused by any kind of mutating webhook. We've seen this on both Azure and AWS. Can I please ask you to confirm if you have these installed?
These are often found alongside log lines from the workflow controller with the word "conflict" in them.
https://kubernetes.io/docs/reference/access-authn-authz/extensible-admission-controllers/
alexec
on 28 Sep 2020
@alexec
Yes there are Mutating Admission Webhook installed but those are for cloud provider specific security and other side-car ingestion use cases. They should not cause any harm to Argo pods.
kubectl api-versions  | grep admissionregistration
admissionregistration.k8s.io/v1
admissionregistration.k8s.io/v1beta1
I also searched for word conflict in our Argo controller logs but there was no such incident regarding it.
However I enabled --logelevel=debug --gloglevel=0 as per your suggestion and I can still see lot of warning messages around
Deadline exceeded
Full stack-trace:
internal-data-ingestiong2qhc error in entry template execution:
Deadline exceeded github.com/argoproj/argo/errors.New
/go/src/github.com/argoproj/argo/errors/errors.go:49
github.com/argoproj/argo/workflow/controller.init
/go/src/github.com/argoproj/argo/workflow/controller/operator.go:109
runtime.doInit
/usr/local/go/src/runtime/proc.go:5222
runtime.doInit
/usr/local/go/src/runtime/proc.go:5217
runtime.main
/usr/local/go/src/runtime/proc.go:190
runtime.goexit
/usr/local/go/src/runtime/asm_amd64.s:1357
@BlackRider97 that probably discounts mutating webhook as the cause.
There are three builds you could try out:
argoproj/workflow-controller:v2.11.2this contains several changes to improve performance - including a reduction in the number of API requests it makes to Kubernetesargoproj/workflow-controller:easyjson- an improved JSON marshaller that also serves diagnostics on port 6060 (https://golang.org/pkg/net/http/pprof/)argoproj/workflow-controller:easyjson-v2- as:easyjsonbut with another performance improvement
alexec
on 6 Oct 2020
@alexec still no luck with argoproj/workflow-controller:v2.11.2 or argoproj/workflow-controller:easyjson
I can see still workflows are getting stuck in forever Running state. This is causing issues in running Argo in reliable way in production.
Consider following example
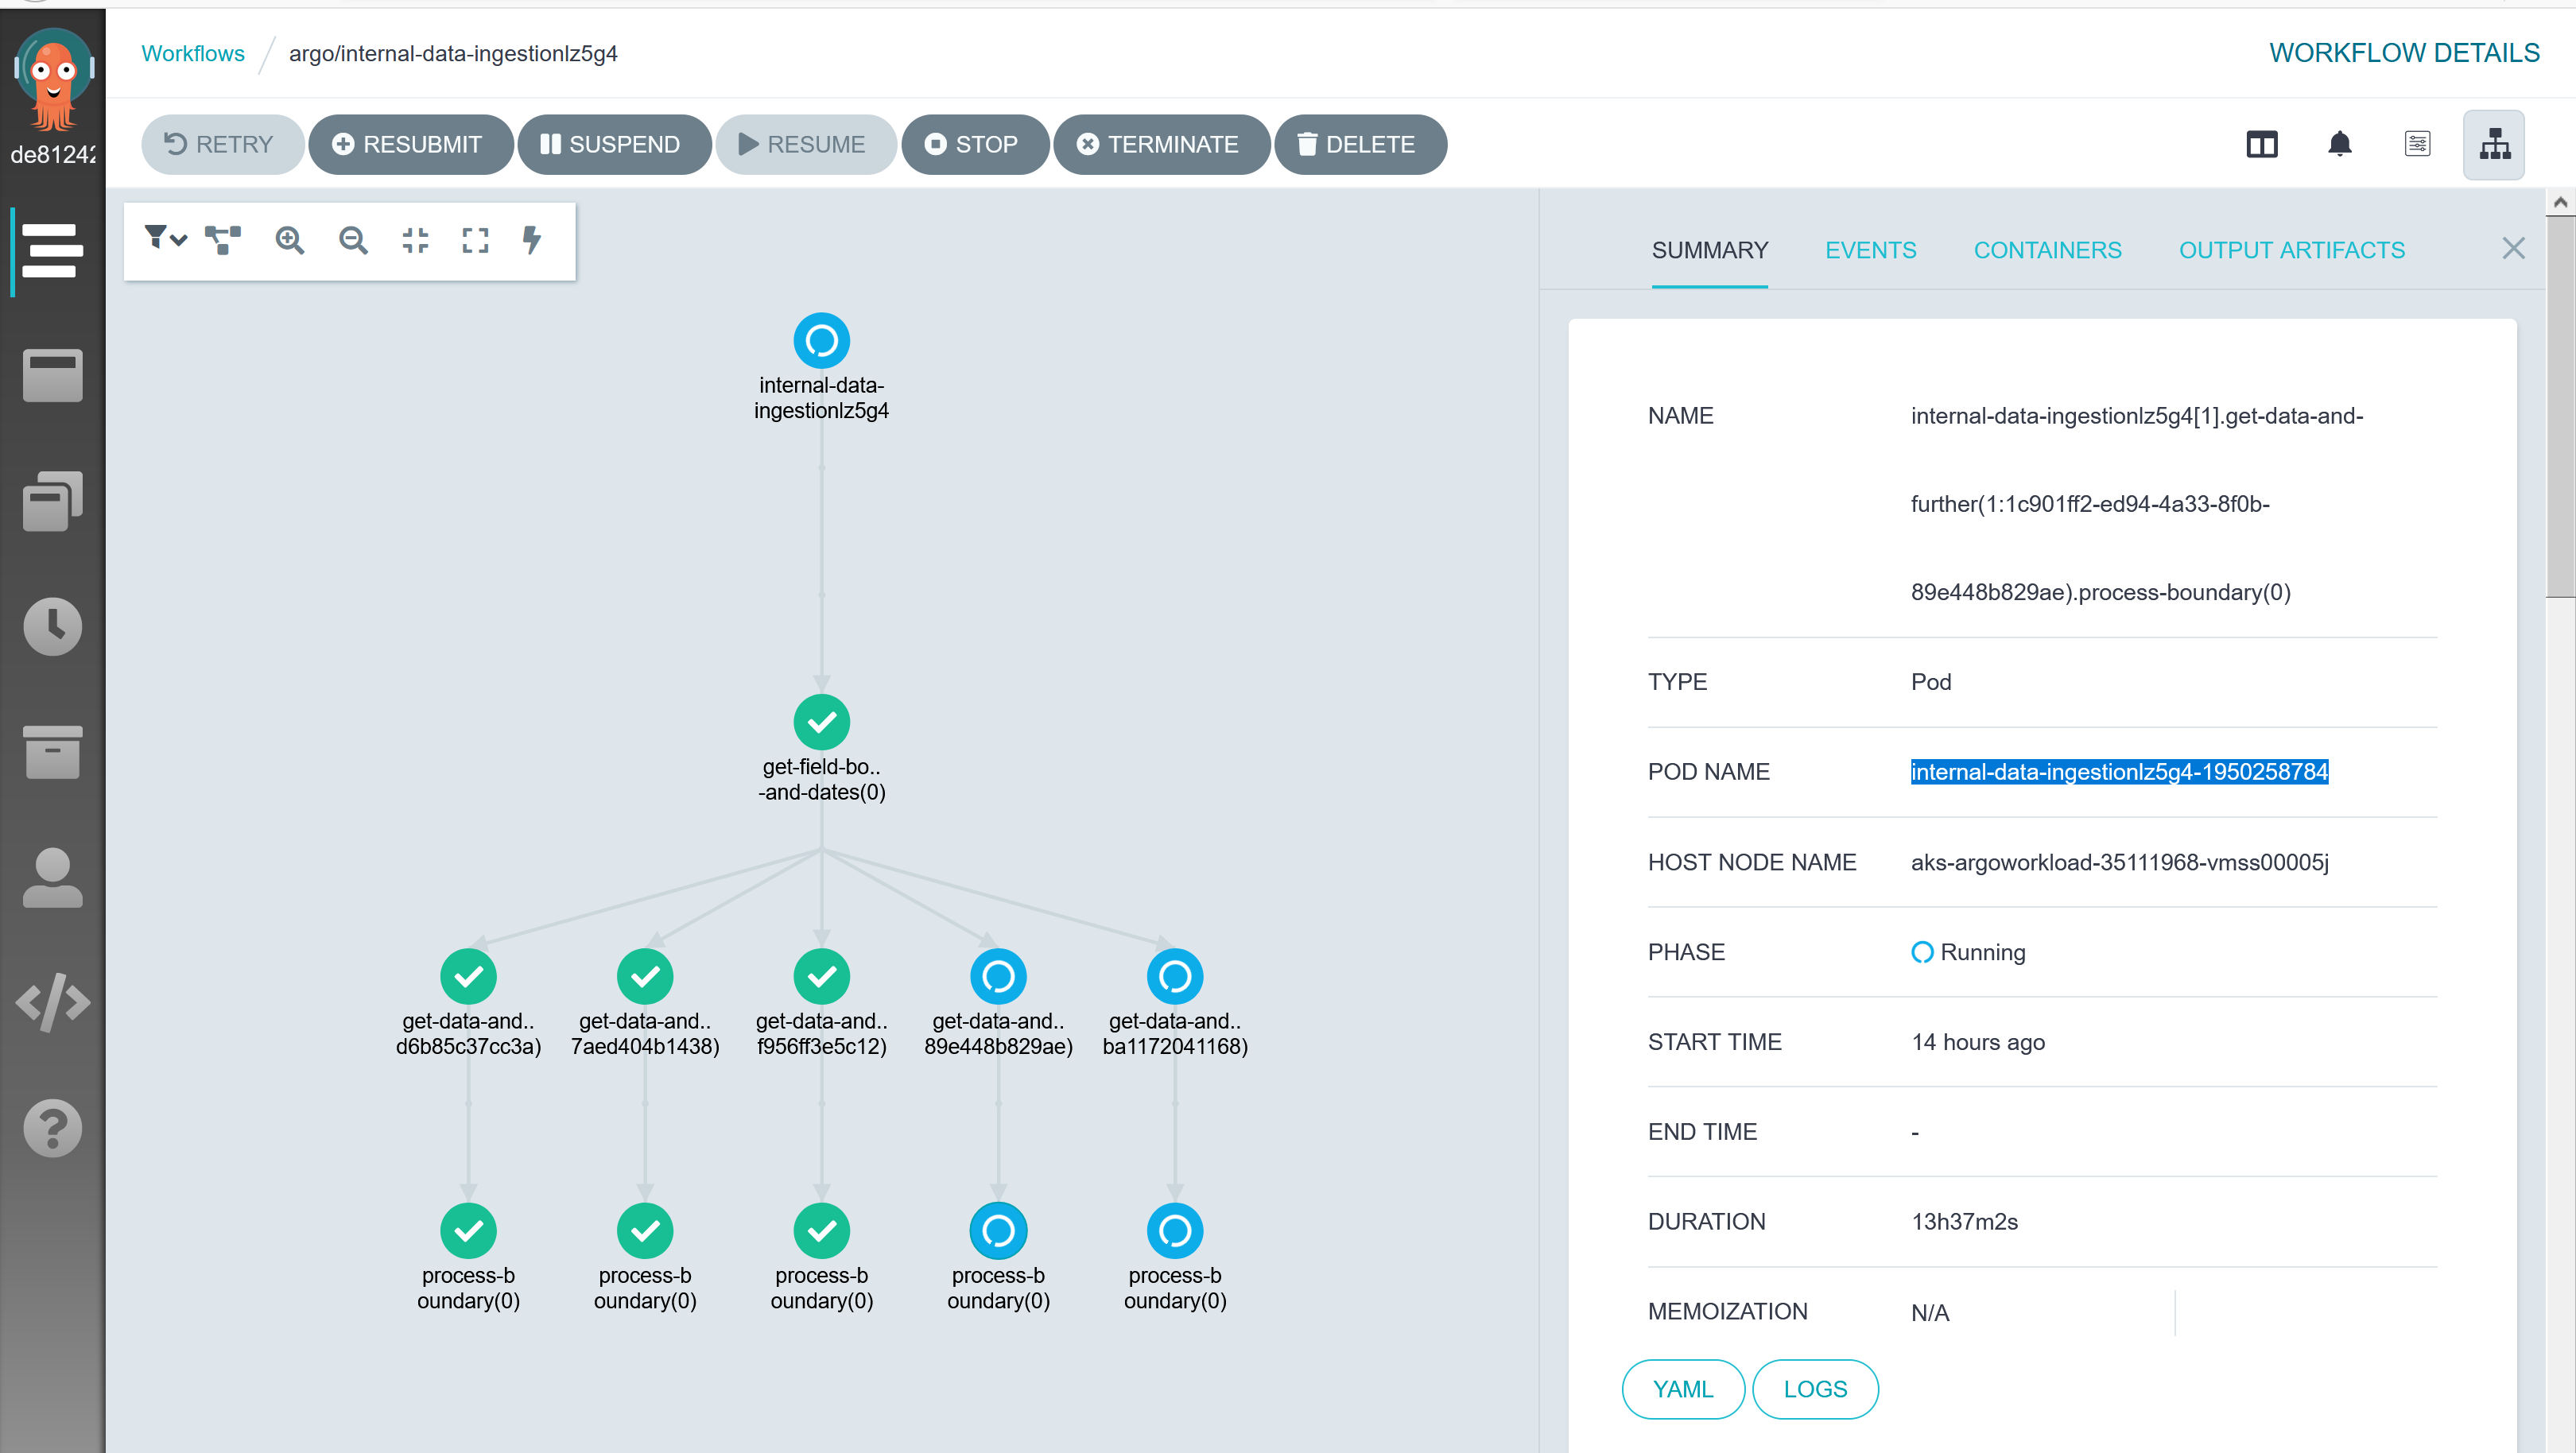
Workflow internal-data-ingestionlz5g4 is running since last 13 hours while according to UI there are two DAG steps which are pending, pod named as internal-data-ingestionlz5g4-918231932 and internal-data-ingestionlz5g4-1950258784.
kubectl get workflows | grep internal-data-ingestionlz5g4
internal-data-ingestionlz5g4              Running   13h

kubectl get pod | grep internal-data-ingestionlz5g4-918231932
internal-data-ingestionlz5g4-918231932               0/2     Completed         0          13h

kubectl get pod | grep internal-data-ingestionlz5g4-1950258784
internal-data-ingestionlz5g4-1950258784              0/2     Completed   0          13h
kubectl describe pod internal-data-ingestionlz5g4-1950258784
Name:         internal-data-ingestionlz5g4-1950258784
Namespace:    argo
Priority:     0
Node:         aks-argoworkload-35111968-vmss00005j/10.240.0.35
Start Time:   Fri, 09 Oct 2020 21:58:57 +0530
Labels:       workflows.argoproj.io/completed=false
              workflows.argoproj.io/workflow=internal-data-ingestionlz5g4
Annotations:  workflows.argoproj.io/node-name:
                internal-data-ingestionlz5g4[1].get-data-and-further(1:1c901ff2-ed94-4a33-8f0b-89e448b829ae).process-boundary(0)
              workflows.argoproj.io/outputs: {"exitCode":"0"}
              workflows.argoproj.io/template:
                {"name":"ingestion-template","arguments":{},"inputs":{"parameters":[{"name":"source","value":"from satellite_sentinelhub_ingestion.batch_u...
Status:       Succeeded
IP:           10.244.36.60
IPs:
  IP:           10.244.36.60
Controlled By:  Workflow/internal-data-ingestionlz5g4
Init Containers:
  init:
    Container ID:  docker://e03afbe74c41be4ab1bcc666dba52cc3d037db2cffe0cc52d5eade3b48eb46d7
    Image:         argoproj/argoexec:v2.11.0
    Image ID:      docker-pullable://argoproj/argoexec@sha256:068d5a5e7ea4f0f816af8a40b24533a18df4a8db9b4b27a91c5b90a63aca3370
    Port:          <none>
    Host Port:     <none>
    Command:
      argoexec
      init
    State:          Terminated
      Reason:       Completed
      Exit Code:    0
      Started:      Fri, 09 Oct 2020 21:58:59 +0530
      Finished:     Fri, 09 Oct 2020 21:58:59 +0530
    Ready:          True
    Restart Count:  0
    Environment:
      ARGO_POD_NAME:  internal-data-ingestionlz5g4-1950258784 (v1:metadata.name)
    Mounts:
      /argo/podmetadata from podmetadata (rw)
      /argo/staging from argo-staging (rw)
      /var/run/secrets/kubernetes.io/serviceaccount from default-token-z74lt (ro)
Containers:
  wait:
    Container ID:  docker://4f8ed9003218fc38bc76db44b511a5c186382684c086b854faa2496b58d6e1a6
    Image:         argoproj/argoexec:v2.11.0
    Image ID:      docker-pullable://argoproj/argoexec@sha256:068d5a5e7ea4f0f816af8a40b24533a18df4a8db9b4b27a91c5b90a63aca3370
    Port:          <none>
    Host Port:     <none>
    Command:
      argoexec
      wait
      State:          Terminated
      Reason:       Completed
      Exit Code:    0
      Started:      Fri, 09 Oct 2020 21:59:00 +0530
      Finished:     Fri, 09 Oct 2020 22:02:44 +0530
    Ready:          False
    Restart Count:  0
    Environment:
      ARGO_POD_NAME:  internal-data-ingestionlz5g4-1950258784 (v1:metadata.name)
    Mounts:
      /argo/podmetadata from podmetadata (rw)
      /mainctrfs/argo/staging from argo-staging (rw)
      /mainctrfs/tmp from temp-dir (rw)
      /var/run/docker.sock from docker-sock (ro)
      /var/run/secrets/kubernetes.io/serviceaccount from default-token-z74lt (ro)
  main:
    Container ID:  docker://2ce3b58dc9ad2523082d293dd01f491e38832051ac70a449890157deade29ecf
    Image:          ingestion:1.0.38
    Image ID:      docker-pullable://ingestion@sha256:b5fd8067a7eb1e39872dc7d26e43edb8847357b6a89555440ce32cbaddac
0397
    Port:          <none>
    Host Port:     <none>
    Command:
      python
    Args:
      /argo/staging/script
    State:          Terminated
      Reason:       Completed
      Exit Code:    0
      Started:      Fri, 09 Oct 2020 21:59:00 +0530
      Finished:     Fri, 09 Oct 2020 22:02:33 +0530
    Ready:          False
    Restart Count:  0
    Environment:
      env:                         dev
    Mounts:
      /argo/staging from argo-staging (rw)
      /tmp from temp-dir (rw)
      /var/run/secrets/kubernetes.io/serviceaccount from default-token-z74lt (ro)
Conditions:
  Type              Status
  Initialized       True
  Ready             False
  ContainersReady   False
  PodScheduled      True
Volumes:
  podmetadata:
    Type:  DownwardAPI (a volume populated by information about the pod)
    Items:
      metadata.annotations -> annotations
  docker-sock:
    Type:          HostPath (bare host directory volume)
    Path:          /var/run/docker.sock
    HostPathType:  Socket
  temp-dir:
    Type:       EmptyDir (a temporary directory that shares a pod's lifetime)
    Medium:
    SizeLimit:  <unset>
  argo-staging:
    Type:       EmptyDir (a temporary directory that shares a pod's lifetime)
    Medium:
    SizeLimit:  <unset>
  default-token-z74lt:
    Type:        Secret (a volume populated by a Secret)
    SecretName:  default-token-z74lt
    Optional:    false
QoS Class:       BestEffort
Node-Selectors:  agentpool=argoworkload
Tolerations:     node.kubernetes.io/not-ready:NoExecute for 300s
                 node.kubernetes.io/unreachable:NoExecute for 300s
Events:          <none>
kubectl describe pod internal-data-ingestionlz5g4-918231932
Name:         internal-data-ingestionlz5g4-918231932
Namespace:    argo
Priority:     0
Node:         aks-argoworkload-35111968-vmss00004z/10.240.0.14
Start Time:   Fri, 09 Oct 2020 21:58:57 +0530
Labels:       workflows.argoproj.io/completed=false
              workflows.argoproj.io/workflow=internal-data-ingestionlz5g4
Annotations:  workflows.argoproj.io/node-name:
                internal-data-ingestionlz5g4[1].get-data-and-further(0:d9660377-9d3f-4d66-9e92-ba1172041168).process-boundary(0)
              workflows.argoproj.io/outputs: {"exitCode":"0"}
              workflows.argoproj.io/template:
                {"name":"ingestion-template","arguments":{},"inputs":{"parameters":[{"name":"source","value":"from satellite_sentinelhub_ingestion.batch_u...
Status:       Succeeded
IP:           10.244.29.98
IPs:
  IP:           10.244.29.98
Controlled By:  Workflow/internal-data-ingestionlz5g4
Init Containers:
  init:
    Container ID:  docker://1562f74a6dfa283c70927769c61ff6c7c521a70e6a9b808263cede5a29172c50
    Image:         argoproj/argoexec:v2.11.0
    Image ID:      docker-pullable://argoproj/argoexec@sha256:068d5a5e7ea4f0f816af8a40b24533a18df4a8db9b4b27a91c5b90a63aca3370
    Port:          <none>
    Host Port:     <none>
    Command:
      argoexec
      init
    State:          Terminated
      Reason:       Completed
      Exit Code:    0
      Started:      Fri, 09 Oct 2020 21:58:58 +0530
      Finished:     Fri, 09 Oct 2020 21:58:58 +0530
    Ready:          True
    Restart Count:  0
    Environment:
      ARGO_POD_NAME:  internal-data-ingestionlz5g4-918231932 (v1:metadata.name)
    Mounts:
      /argo/podmetadata from podmetadata (rw)
      /argo/staging from argo-staging (rw)
      /var/run/secrets/kubernetes.io/serviceaccount from default-token-z74lt (ro)
Containers:
  wait:
    Container ID:  docker://39987728958ebb4b6b3670d200d9e0674003e93336c0950054a97f1d9157678f
    Image:         argoproj/argoexec:v2.11.0
    Image ID:      docker-pullable://argoproj/argoexec@sha256:068d5a5e7ea4f0f816af8a40b24533a18df4a8db9b4b27a91c5b90a63aca3370
    Port:          <none>
    Host Port:     <none>
    Command:
      argoexec
      wait
    State:          Terminated
      Reason:       Completed
      Exit Code:    0
      Started:      Fri, 09 Oct 2020 21:58:59 +0530
      Finished:     Fri, 09 Oct 2020 22:04:22 +0530
    Ready:          False
    Restart Count:  0
    Environment:
      ARGO_POD_NAME:  internal-data-ingestionlz5g4-918231932 (v1:metadata.name)
    Mounts:
      /argo/podmetadata from podmetadata (rw)
      /mainctrfs/argo/staging from argo-staging (rw)
      /mainctrfs/tmp from temp-dir (rw)
      /var/run/docker.sock from docker-sock (ro)
      /var/run/secrets/kubernetes.io/serviceaccount from default-token-z74lt (ro)
  main:
    Container ID:  docker://3b70d83a2d00ef52a3a52d4b07cd4ee45e573091597099505b3515d5aee1470d
    Image:         ingestion:1.0.38
    Image ID:      docker-pullable://ingestion@sha256:b5fd8067a7eb1e39872dc7d26e43edb8847357b6a89555440ce32cbaddac
0397
    Port:          <none>
    Host Port:     <none>
    Command:
      python
    Args:
      /argo/staging/script
    State:          Terminated
      Reason:       Completed
      Exit Code:    0
      Started:      Fri, 09 Oct 2020 21:58:59 +0530
      Finished:     Fri, 09 Oct 2020 22:04:19 +0530
    Ready:          False
    Restart Count:  0
    Environment:
      env:                         dev
    Mounts:
      /argo/staging from argo-staging (rw)
      /tmp from temp-dir (rw)
      /var/run/secrets/kubernetes.io/serviceaccount from default-token-z74lt (ro)
Conditions:
  Type              Status
  Initialized       True
  Ready             False
  ContainersReady   False
  PodScheduled      True
Volumes:
  podmetadata:
    Type:  DownwardAPI (a volume populated by information about the pod)
    Items:
      metadata.annotations -> annotations
  docker-sock:
    Type:          HostPath (bare host directory volume)
    Path:          /var/run/docker.sock
    HostPathType:  Socket
  temp-dir:
    Type:       EmptyDir (a temporary directory that shares a pod's lifetime)
    Medium:
    SizeLimit:  <unset>
  argo-staging:
    Type:       EmptyDir (a temporary directory that shares a pod's lifetime)
    Medium:
    SizeLimit:  <unset>
  default-token-z74lt:
    Type:        Secret (a volume populated by a Secret)
    SecretName:  default-token-z74lt
    Optional:    false
QoS Class:       BestEffort
Node-Selectors:  agentpool=argoworkload
Tolerations:     node.kubernetes.io/not-ready:NoExecute for 300s
                 node.kubernetes.io/unreachable:NoExecute for 300s
Events:          <none>
kubectl describe workflow internal-data-ingestionlz5g4 | grep "internal-data-ingestionlz5g4-918231932\|internal-data-ingestionlz5g4-1950258784" -B10 -A2
            f:id:
            f:inputs:
              .:
              f:parameters:
            f:name:
            f:phase:
            f:startedAt:
            f:templateName:
            f:templateScope:
            f:type:
          f:internal-data-ingestionlz5g4-1950258784:
            .:
            f:boundaryID:
--
              f:exitCode:
            f:phase:
            f:resourcesDuration:
              .:
              f:cpu:
              f:memory:
            f:startedAt:
            f:templateName:
            f:templateScope:
            f:type:
          f:internal-data-ingestionlz5g4-918231932:
            .:
            f:boundaryID:
--
      Inputs:
        Parameters:
          Name:        boundary_id
          Value:       d9660377-9d3f-4d66-9e92-ba1172041168
      Name:            internal-data-ingestionlz5g4[1].get-data-and-further(0:d9660377-9d3f-4d66-9e92-ba1172041168)
      Phase:           Running
      Started At:      2020-10-09T16:28:57Z
      Template Name:   ingestion-dag-flow
      Template Scope:  local/internal-data-ingestionlz5g4
      Type:            DAG
    internal-data-ingestionlz5g4-1950258784:
      Boundary ID:     internal-data-ingestionlz5g4-161541463
      Display Name:    process-boundary(0)
      Finished At:     <nil>
      Host Node Name:  aks-argoworkload-35111968-vmss00005j
      Id:              internal-data-ingestionlz5g4-1950258784
      Inputs:
        Parameters:
--

      Name:            internal-data-ingestionlz5g4[1].get-data-and-further(1:1c901ff2-ed94-4a33-8f0b-89e448b829ae).process-boundary(0)
      Phase:           Running
      Started At:      2020-10-09T16:28:57Z
      Template Name:   ingestion-template
      Template Scope:  local/internal-data-ingestionlz5g4
      Type:            Pod
    internal-data-ingestionlz5g4-2187362093:
      Boundary ID:  internal-data-ingestionlz5g4-1898179939
      Children:
        internal-data-ingestionlz5g4-918231932
      Display Name:  process-boundary
      Finished At:   <nil>
--

      Name:            internal-data-ingestionlz5g4[1].get-data-and-further(0:d9660377-9d3f-4d66-9e92-ba1172041168).process-boundary
      Phase:           Running
      Started At:      2020-10-09T16:28:57Z
      Template Name:   ingestion-template
      Template Scope:  local/internal-data-ingestionlz5g4
      Type:            Retry
    internal-data-ingestionlz5g4-2427204537:
      Boundary ID:  internal-data-ingestionlz5g4-161541463
      Children:
        internal-data-ingestionlz5g4-1950258784
      Display Name:  process-boundary
      Finished At:   <nil>
--
      Outputs:
        Exit Code:  0
      Phase:        Succeeded
      Resources Duration:
        Cpu:           201
        Memory:        201
      Started At:      2020-10-09T16:28:57Z
      Template Name:   ingestion-template
      Template Scope:  local/internal-data-ingestionlz5g4
      Type:            Pod
    internal-data-ingestionlz5g4-918231932:
      Boundary ID:     internal-data-ingestionlz5g4-1898179939
      Display Name:    process-boundary(0)
      Finished At:     <nil>
      Host Node Name:  aks-argoworkload-35111968-vmss00004z
      Id:              internal-data-ingestionlz5g4-918231932
      Inputs:
        Parameters:
I have seen another incident for long running workflow where workflow is in Running state while corresponding Pods already completed. May be Argo controller is not able read Pod's completion state or some race conditions.
FYI I ran 100k workflows with 100 parallelism limit, and 2 workflows went into this in-consistent state.
@alexec
BlackRider97
on 12 Oct 2020
Did you have any luck restarting the controller? This would force a reconciliation of your workflow.
alexec
on 12 Oct 2020
I'd like to have another Zoom on your issue if you can be free please.
alexec
on 13 Oct 2020
As you are aware, we are taking this seriously. We have already rolled out one key for large numbers of items (i.e. withParams or withItems) and have two other PRs in review to address the throttler bug and support controller HA.
What I don't have for this issue is a way to reproduce it. People are able to successfully run 10k+ node workflow on v2.11.3.
In there anyway we can get a workflow that repos the issue please?
Thank you,
Alex
alexec
on 14 Oct 2020
This issue has been automatically closed because there has been no response to our request for more information from the original author. With only the information that is currently in the issue, we don't have enough information to take action. Please reach out if you have or find the answers we need so that we can investigate further.
![no-response[bot] picture](https://avatars2.githubusercontent.com/u/26350515?v=4&s=40) no-response[bot]
on 28 Oct 2020
no-response[bot]
on 28 Oct 2020
Can we reopen this issue? We are running into this issue as well consistently running long workflows and can provide more information as well as some telemetry information. We are using v2.11.6 on an autoscaling EKS cluster, and our workflows use withParams
 jayz28
on 29 Oct 2020
jayz28
on 29 Oct 2020
@jayz28 did you previously have this problem? Or is it a new problem?
alexec
on 29 Oct 2020
@jayz28 did you previously have this problem? Or is it a new problem?
We have only recently started noticing this issue when we moved to production scale. Previously at testing loads we didn't notice the issue.
jayz28
on 29 Oct 2020
@jayz28 we have 3 users running a massive scale now having similar issues. Essentially, at some point we don't see the pod updates.
Can I ask you try this image argoproj/workflow-controller:no-sig and see if that works? It typically takes 30m to fix problems, so you may have to wait.
alexec
on 29 Oct 2020
@jayz28 we have 3 users running a massive scale now having similar issues. Essentially, at some point we don't see the pod updates.
Can I ask you try this image
argoproj/workflow-controller:no-sigand see if that works? It typically takes 30m to fix problems, so you may have to wait.
Sure, making the update now. Would it resolve workflows already in progress or do I need to launch new workflows?
jayz28
on 29 Oct 2020
I think you'll find if you restart the controller, your zombie workflows will come alive again.
alexec
on 29 Oct 2020
This issue has been automatically closed because there has been no response to our request for more information from the original author. With only the information that is currently in the issue, we don't have enough information to take action. Please reach out if you have or find the answers we need so that we can investigate further.
no-response[bot]
on 29 Oct 2020
I think you'll find if you restart the controller, your zombie workflows will come alive again.
Looks like the :no-sig image has resolved the problem, we are no longer seeing the error and all the workflows are now progressing. Curious what was specific issue? Hopefully the fix will be merged soon.
jayz28
on 29 Oct 2020
This issue has been automatically closed because there has been no response to our request for more information from the original author. With only the information that is currently in the issue, we don't have enough information to take action. Please reach out if you have or find the answers we need so that we can investigate further.
no-response[bot]
on 29 Oct 2020
Looks like the :no-sig image has resolved the problem, we are no longer seeing the error and all the workflows are now progressing. Curious what was specific issue? Hopefully the fix will be merged soon.
Can you confirm if this was an issue resolves straight-away, or after 30m?
alexec
on 29 Oct 2020
Looks like the :no-sig image has resolved the problem, we are no longer seeing the error and all the workflows are now progressing. Curious what was specific issue? Hopefully the fix will be merged soon.
Can you confirm if this was an issue resolves straight-away, or after 30m?
It appears to have resolved right away.
jayz28
on 29 Oct 2020
Can you please try :latest?
alexec
on 29 Oct 2020
So far so good using the :latest image.
jayz28
on 30 Oct 2020
Is it resolved straight away?
alexec
on 31 Oct 2020
Is it resolved straight away?
Yes, it started to resolve very quickly after applying the changes. Curious what was the cause for the issue?
jayz28
on 1 Nov 2020
Can I confirm that they were resolved using :latest or using :no-sig?
alexec
on 1 Nov 2020
Can I confirm that they were resolved using :latest or using :no-sig?
Initially trying :no-sig resolved our stuck workflows. We have since been load testing using :latest and have not encountered the issue, running similar loads.
jayz28
on 1 Nov 2020
Ok. So we can shelve :no-sig.
alexec
on 1 Nov 2020
The issue description and comments sound exactly like what we're experiencing on 2.11.6. "stuck" workflow steps without running pods. @alexec we briefly chatted in Slack and you suggested upgrading to 2.11.7 - would :latest be a better idea instead?
 ebr
on 18 Nov 2020
ebr
on 18 Nov 2020
@ebr try them both.
alexec
on 18 Nov 2020
Still an issue with 2.11.7 (i can share some screenshots privately or Zoom). I also raised --qps, --burst and --pod-workers to 10x-20x above than the defaults.
:latest is 2.12.x - will trying it prevent me from reverting to 2.11.7 (we're offloading to Postgres)
ebr
on 18 Nov 2020
You should be able to revert, but I'd recommend you try in a test env.
alexec
on 19 Nov 2020
We are not lucky enough to have a test env :) In a middle of a massive production run right now. so we're doing it live.
I went for 2.12.0-rc2, and as soon as I upgraded the controller, a lot of the step nodes got "unstuck" and shot for the moon, creating almost all of the pods. but some kind of upper bound still exists. E.g., deploying a workflow with a withItems step which is supposed to create ~8000 iterations of the item, it only gets to item ~(3600:3600) and stalls, like before. In 2.11.7, this upper bound was around 2100 items, but it also seems to depend on the total number of pods the workflow controller is currently handling. I can't find a concrete pattern to it, but the symptoms are reproducible. So 2.12 definitely helps, but not entirely. We are currently working around this by breaking our workflows into chunks that will not create more than 2000 iterations of any step.
ebr
on 19 Nov 2020
Does it come unstuck after 20m (at which time there is a resync)?
alexec
on 19 Nov 2020
Unfortunately, no. E.g. we have a couple of wfs right now that have been "stuck" this way with 0 pods (because they have been GC'd), but no new pods are being created for those wfs. Other wfs (like the chunked-up ones i described above) are happily creating pods though.
ebr
on 19 Nov 2020
Can we Zoom? I'd like to investigate online.
alexec
on 19 Nov 2020
That would be fantastic. Could we organize it for tomorrow, as it's getting late here (EST)? I'll make sure to keep the stuck workflows around (though it's reproducible, so that's not an issue). I can message you on Slack to organize, if that's ok.
ebr
on 19 Nov 2020
I'm in PST.
alexec
on 19 Nov 2020
We're seeing the exact issues in 2.11 as well, when submitting hundreds of workflows. If possible, I'd be delighted to join the call.
 jkgeyti
on 19 Nov 2020
jkgeyti
on 19 Nov 2020
Ping me on the Slack channel.
alexec
on 19 Nov 2020
Closing as we have #4560 now.
alexec
on 19 Nov 2020
Related issues
 CermakM
·
3Comments
CermakM
·
3Comments
 stevef1uk
·
4Comments
stevef1uk
·
4Comments
 nelsonfassis
·
4Comments
nelsonfassis
·
4Comments
 iterion
·
3Comments
iterion
·
3Comments
 salanki
·
3Comments
salanki
·
3Comments