Argo-cd: Default grafana dashboard is invalid
Checklist:
- [x] I've searched in the docs and FAQ for my answer: http://bit.ly/argocd-faq.
- [x] I've included steps to reproduce the bug.
Describe the bug
The Grafana dashboard provided in the monitoring page for Argo (https://github.com/argoproj/argo-cd/blob/master/examples/dashboard.json) is not valid on a brand new argo installation with Prometheus Operator :
- it contains all kind of hard-coded data (like the clusters list for example)
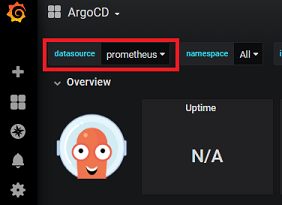
- each panel assumed the default datasource to be "Prometheus". If Prometheus was not the default datasource (for example, with Prometheus operator, the default datasource is "prometheus" in lowercase), then all panels are broken.
(=> To fix it, the panels should have the same value as the variable ${DS_PROMETHEUS} which is set when importing the panel)
In conclusion, when we import it in a grafana instance deployed in the same cluster as argocd, it simply does not work (and in this case, grafana replace all incorrect queries by random values)
Is it possible to provide a valid argocd grafana dashboard please ?
To Reproduce
Import the dashboard in a grafana instance deployed in the same cluster as argo.
Expected behavior
The dashboard should work without having to modify it.
 yogeek
All 4 comments
I faced the same problem.
At least I needed the following modifications to import the dashboard in my cluster.
https://github.com/cybozu-go/neco-apps/commit/4fede1adf8d97b010af975b2cda836b0d4163a88#diff-fb96f371257b6780e3c3da66cfa3aca8
 masa213f
on 16 Apr 2020
masa213f
on 16 Apr 2020
Thank you @masa213f
But I do not understand : how can it work as you set all datasources to null ?
yogeek
on 16 Apr 2020
@yogeek
Thanks. I had a misunderstanding.
"datasource": null means using the default datasource.
https://github.com/grafana/grafana/issues/1919
My Grafana has only one datasource, so it works fortunately.
But if there are multiple datasources, this change does not work. The datasoruce cannot be switched.
The current dashboard can select a datasource.
The value may reference by $datasource. So we should use "datasource": "$datasource".
masa213f
on 17 Apr 2020
Thank you for noticing it. Just sent PR which uses "datasource": "$datasource"
 alexmt
on 17 Apr 2020
alexmt
on 17 Apr 2020
Related issues
 ksaito1125
·
3Comments
ksaito1125
·
3Comments
 turbotankist
·
3Comments
turbotankist
·
3Comments
 chiragthaker
·
3Comments
chiragthaker
·
3Comments
 duboisf
·
3Comments
duboisf
·
3Comments
 alexec
·
3Comments
alexec
·
3Comments
Most helpful comment
Thank you for noticing it. Just sent PR which uses
"datasource": "$datasource"