Arduino-pro-ide: [linux] Unable to start debug session - Error "this.gdbServer.off is not a function"
Describe the bug
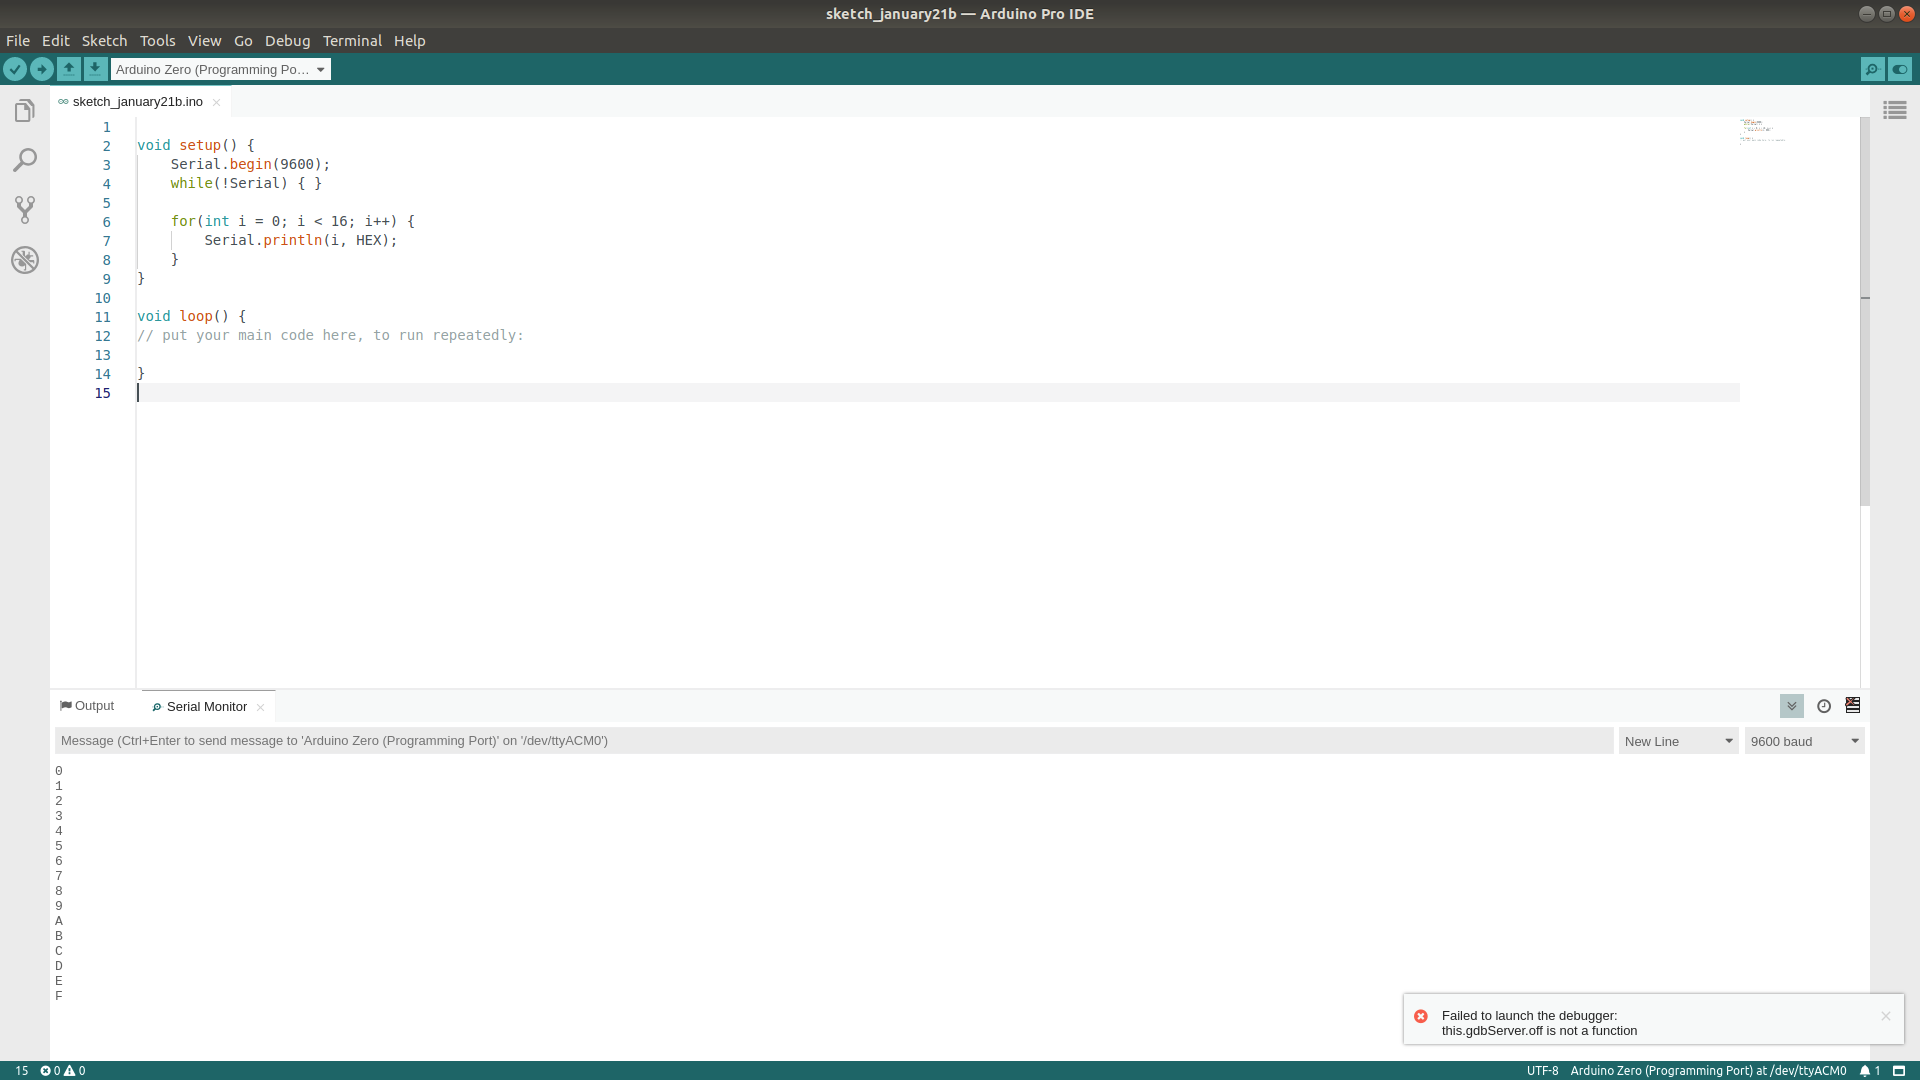
When attempting to start the debugger the error message "this.gdbServer.off is not a function" appears.
To Reproduce
Steps to reproduce the behavior:
- Switch to Advanced Mode
- Create a simple test sketch
- Compile and download to board to verify programming and downloading works (and view output in serial monitor)
- Press Debug -> Start Debugging.
Expected behavior
I would have expected to be launched into some kind of debugging mode where I can single-step the program.
Screenshots
The error message is visible in the lower / right corner of the IDE. No output on the console used to launch the Pro IDE.
Debug Console Output
Info : CMSIS-DAP: FW Version = 02.01.0157
Info : SWCLK/TCK = 1 SWDIO/TMS = 1 TDI = 1 TDO = 1 nTRST = 0 nRESET = 1
Info : CMSIS-DAP: Interface ready
Info : clock speed 400 kHz
Info : SWD DPIDR 0x0bc11477
Info : at91samd21g18.cpu: hardware has 4 breakpoints, 2 watchpoints
Info : Listening on port 50000 for gdb connections
Info : accepting 'gdb' connection on tcp/50000
Info : SAMD MCU: SAMD21G18A (256KB Flash, 32KB RAM)
undefined debug reason 7 - target needs reset
0x0000060c in ?? ()
target halted due to debug-request, current mode: Thread
xPSR: 0x61000000 pc: 0x0000060c msp: 0x20007ffc
target halted due to debug-request, current mode: Thread
xPSR: 0x61000000 pc: 0x0000060c msp: 0x20007ffc
Attached to debugger on port 50000
Desktop (please complete the following information):
- OS:
Ubuntu 18.04.3 LTS - Pro IDE:
Arduino Pro IDE-0.0.4-3e8c609-linux
Additional Information
- Debugger:
Black Magic Probe V2.0 - Target Board:
Arduino Zero
 aentinger
All 2 comments
Solved.
 spoenemann
on 23 Jan 2020
spoenemann
on 23 Jan 2020
I can confirm that debugging works now for Arduino Pro IDE-0.0.4-dd0b9bf-linux :+1:
aentinger
on 24 Jan 2020
🎉2
Was this page helpful?
0 / 5 - 0 ratings
Related issues
 talofer99
·
8Comments
talofer99
·
8Comments
 DoodlesEpic
·
4Comments
DoodlesEpic
·
4Comments
 DeeEmm
·
6Comments
DeeEmm
·
6Comments
 OMGdaDPS
·
5Comments
OMGdaDPS
·
5Comments
 Erriez
·
5Comments
Erriez
·
5Comments
Most helpful comment
I can confirm that debugging works now for Arduino Pro IDE-0.0.4-dd0b9bf-linux :+1: