Apollo-tooling: [Swift] Huge performance regression
Going from 2.17.4 to 2.18.3. Codegen time ballooned from 40s to 240s.
codegen:generate --includes='./**/*.graphql' --localSchemaFile="schema.json" --passthroughCustomScalars --target=swift Sources/Core/Generated/
How to reproduce the issue:
To help understand the size of this project:
87 .graphql files
schema is 136,639 lines
Sources/Core/Generated/ is 2.2MB
Versions
2.18.3
cc @designatednerd
 cltnschlosser
All 22 comments
If you can give me any tips on how to debug a typescript application, I can get more information. Can you use instruments or something like it?
cltnschlosser
on 1 Oct 2019
I know @lilyball had some concerns there might be some performance issues with stuff which was recently changed - Lily do you have specific thoughts around where that might be?
Asking the tooling team for suggestions on debugging, I'm definitely in dog-in-a-lab-coat-and-goggles territory with Typescript, unfortunately.
 designatednerd
on 1 Oct 2019
designatednerd
on 1 Oct 2019
@designatednerd For my recent SwiftSource changes, I ran apollo client:codegen on my production project with both versions (a version from before the change and the version published after) and saw no meaningful performance difference.
I have noticed that it's taking a lot longer than I expected in general though. I may have to do some version bisecting to see when the performance regression happened.
If possible, we should also look into adding some benchmarks to the project. I don't know offhand how to do that though.
 lilyball
on 1 Oct 2019
lilyball
on 1 Oct 2019
Oh wow, I must have measured incorrectly before. 2.18.0 take 50 seconds on my project. 2.17.4 takes 7. That's bad.
If this is due to the SwiftSource changes, then a) ouch, that's a really bad performance hit for wrapping strings in objects, and b) I have some thoughts about an alternative approach that uses type punning instead of constructing actual objects at runtime.
lilyball
on 1 Oct 2019
This would be significantly easier to test if I could actually get packages/apollo/bin/run client:codegen to work on my machine. I don't know why that fails for me.
lilyball
on 1 Oct 2019
Oh crud, my type punning approach isn't compatible with letting you interpolate these values with the swift template literal tag because that requires runtime representation, which is a pretty big usability issue.
I wonder if I could hack this by prefixing these strings with some magic characters and then stripping that out when interpolating them or printing them? That's nasty though.
lilyball
on 2 Oct 2019
Yeah magic characters seems like it could be extremely prone to error as well.
I plan to add performance tests on the Swift codegen to prevent stuff like this in the future, but my lack of typescript knowledge is really hurting in terms of figuring out why a regression like this would happen
designatednerd
on 2 Oct 2019
Magic characters would be coupled with the type punning approach, and would exist so the swift template tag could then detect that it's a SwiftSource and avoid escaping it. This would of course be a problem if we pass this to any other code that takes an any and relies on runtime type-checking because anything else that looks for a string would then misinterpret it. If we're ok with "passing it as any is unsafe" then this is doable, though awkward.
I do wonder if instead we could just reduce the number of independent SwiftSource instances we create?
I also haven't yet checked if there's anything else in the 2.18.0 release that could be impacting performance.
lilyball
on 2 Oct 2019
I wish I knew how to do actual performance profiling on JavaScript.
lilyball
on 2 Oct 2019
@lilyball It's not the easiest to use, but you can do this: https://nodejs.org/en/docs/guides/simple-profiling/ or run with node --inspect and use chrome chrome://inspect, to use the profiler in chrome.
node packages/apollo/bin/run client:codegen should work, just add the flags you want
cltnschlosser
on 2 Oct 2019
Turns out I was right the first time; SwiftSource was in 2.18.2, but the performance regression was in 2.18.0.
I tried the node --inspect approach but the Chrome profiler seems really hard to use. I think we're going to have to bisect the changes from 2.17.4 to 2.18.0 to see where the slowdown came from.
lilyball
on 2 Oct 2019
That's bizarre! Looking on master at the commits between those two releases doesn't show anything that jumps out at me as suspicious:
Here's the diff between those two tags - nothing seems to have been touched in the Swift package in that changeset. @JakeDawkins Any thoughts on what this could possibly be?
designatednerd
on 2 Oct 2019
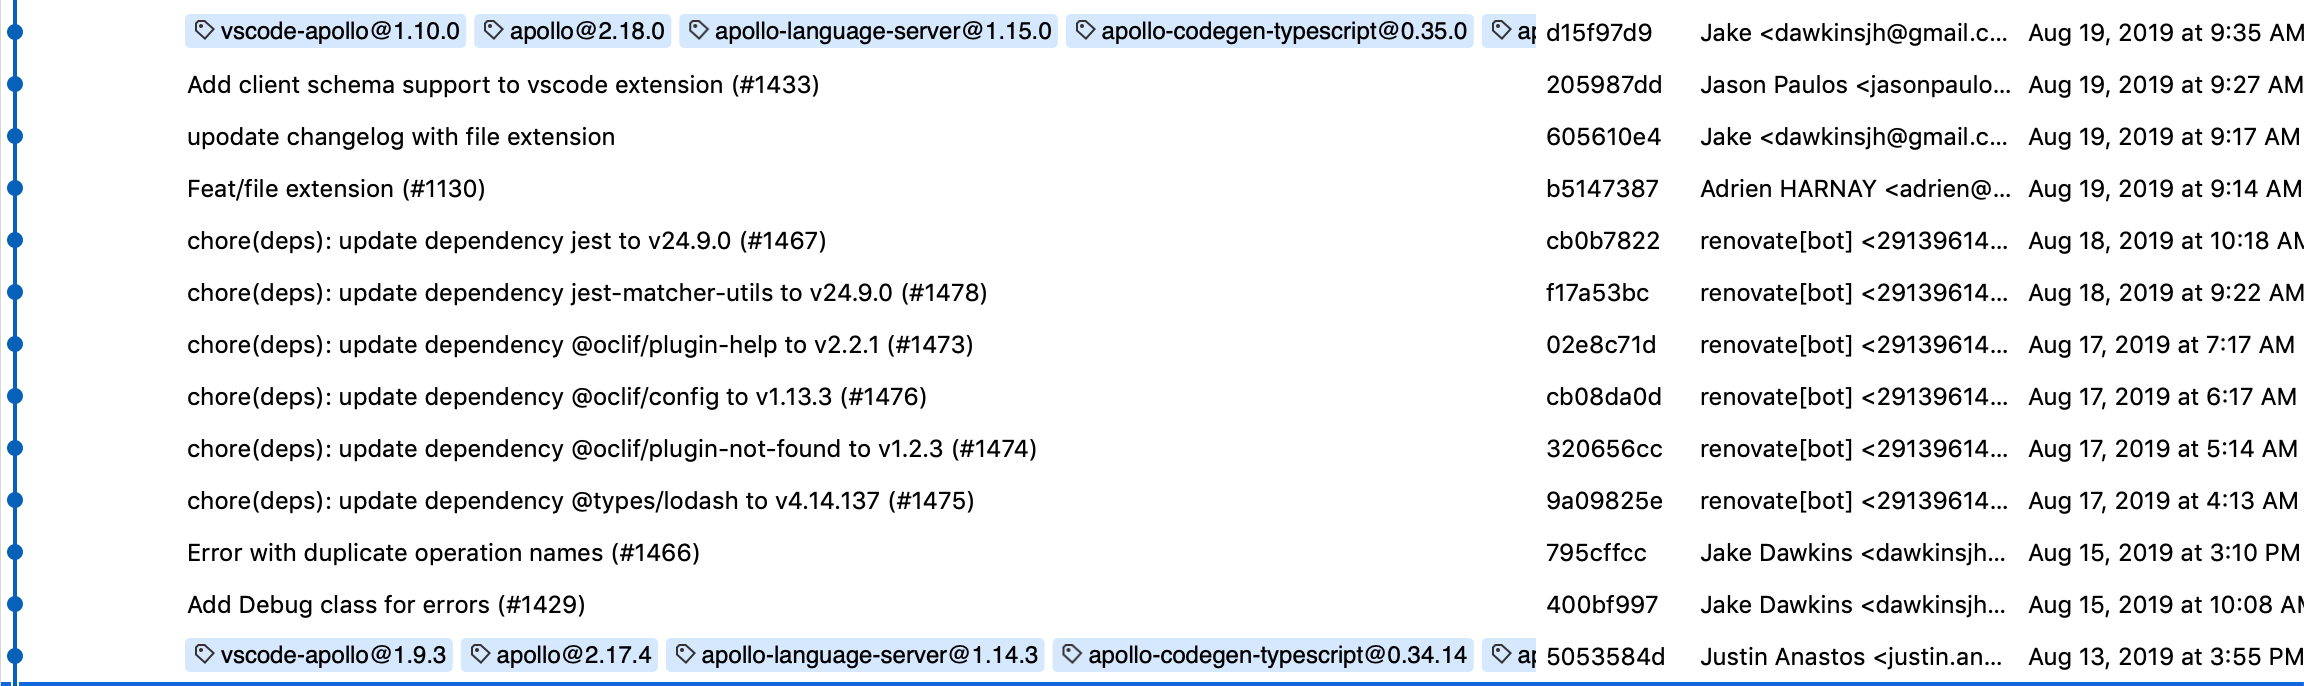
Bisect says the bad commit was 205987dd42fc34861efb14f2c5d235931c15fade. That commit only touches apollo-language-server and vscode-apollo though, so I don't know what's going on. But it is reproducible; running that commit is slow, running the parent commit is fast.
lilyball
on 2 Oct 2019
Well, apollo-codegen-core apparently depends on apollo-language-server, so I guess that's how this can affect things. It looks like it's only requiring that to get the ToolError type but maybe merely importing it is turning on runtime debugging or something like that.
lilyball
on 2 Oct 2019
Oh hey, the apollo package itself also imports it quite a lot.
lilyball
on 2 Oct 2019
Ran the node profiler on two versions of the codegen (attached the full output)
2.17.4
2.18.3
Snippet from before:
[JavaScript]:
   ticks  total  nonlib   name
    931    4.3%    4.4%  Builtin: KeyedLoadIC_Megamorphic
    689    3.2%    3.2%  Builtin: LoadIC
    406    1.9%    1.9%  Builtin: ObjectAssign
    308    1.4%    1.4%  LazyCompile: *visit path/node_modules/graphql/language/visitor.js:154:15
    268    1.2%    1.3%  Builtin: StringAdd_CheckNone_NotTenured
    239    1.1%    1.1%  Builtin: RegExpMatchFast
    221    1.0%    1.0%  Builtin: KeyedLoadIC
    203    0.9%    1.0%  Builtin: RegExpReplace
    185    0.9%    0.9%  Builtin: InterpreterEntryTrampoline
    143    0.7%    0.7%  LazyCompile: *enter path/node_modules/graphql/language/visitor.js:316:26
    136    0.6%    0.6%  LazyCompile: *structNameForPropertyName path/node_modules/apollo-codegen-swift/lib/helpers.js:84:30
Snippet from after:
 [JavaScript]:
   ticks  total  nonlib   name
  79407   37.0%   37.1%  LazyCompile: *visit path/node_modules/graphql/language/visitor.js:154:15
  49830   23.2%   23.3%  Builtin: KeyedLoadIC_Megamorphic
  30163   14.1%   14.1%  Builtin: LoadIC
  11749    5.5%    5.5%  Builtin: KeyedLoadIC
   3331    1.6%    1.6%  LazyCompile: *visitor path/node_modules/apollo-language-server/lib/utilities/source.js:120:21
   2158    1.0%    1.0%  Builtin: KeyedLoadICTrampoline
   1837    0.9%    0.9%  Builtin: LoadICTrampoline
    796    0.4%    0.4%  Builtin: ArgumentsAdaptorTrampoline
    635    0.3%    0.3%  Builtin: CallFunction_ReceiverIsAny
    471    0.2%    0.2%  Builtin: ObjectAssign
    397    0.2%    0.2%  Builtin: InterpreterEntryTrampoline
    357    0.2%    0.2%  Builtin: StringAdd_CheckNone_NotTenured
    328    0.2%    0.2%  Builtin: RegExpReplace
    319    0.1%    0.1%  Builtin: RegExpMatchFast
    246    0.1%    0.1%  Builtin: CompileLazy
    229    0.1%    0.1%  LazyCompile: *enter path/node_modules/graphql/language/visitor.js:316:26
    228    0.1%    0.1%  Builtin: Call_ReceiverIsAny
    203    0.1%    0.1%  LazyCompile: *structNameForPropertyName path/node_modules/apollo-codegen-swift/lib/helpers.js:85:30
If I'm reading this right, the two biggest culprits are:
graphql/language/visitor.js:154:15
apollo-language-server/lib/utilities/source.js:120:21
which seems to point at: https://github.com/apollographql/apollo-tooling/commit/205987dd42fc34861efb14f2c5d235931c15fade#diff-0c60b49eae98a1397b58fd95a4195d59
But I'm not experienced in JS or node, so I could be interpreting this all wrong.
cltnschlosser
on 2 Oct 2019
If it's really doing that much visiting, then either isFieldResolvedLocally's visitor callback must be really expensive (e.g. node.directives is a huge array), or it must just be revisiting everything a _lot_.
lilyball
on 2 Oct 2019
After looking at this a bit, it appears that for every single field it re-visits the _entire AST_ just to find out if that field is inside a client directive.
A much more sane way to do this is to visit the entire AST once, and annotate the nodes that are in client directives (if we can't modify the nodes directly, perhaps we can stuff them in a lookup table that we can check in O(1) instead).
lilyball
on 2 Oct 2019
@lilyball @cltnschlosser I've taken a first stab at fixing this issue in #1559. We need to do some manual testing since we have such a lacking in automated tests here but I think it is promising. It also fills a few (all but one) gap with local state detection though I don't imagine that is useful to y'all as it isn't yet supported on native?
 jbaxleyiii
on 3 Oct 2019
jbaxleyiii
on 3 Oct 2019
@jbaxleyiii Tested your branch on my project and performance improved significantly. Not sure how I got the 40s number before, but on 2.17.4 I'm seeing ~21s after several runs and ~23s with your branch.
cltnschlosser
on 3 Oct 2019
Working on a release for this now, I'll update with a version once it's out
 JakeDawkins
on 4 Oct 2019
JakeDawkins
on 4 Oct 2019
I upgraded from 2.18.3 to 2.19.1 and I went from ~140 second to ~2 seconds on around 180 queries. :smile:
Good job.
 karl-run
on 11 Oct 2019
karl-run
on 11 Oct 2019
Related issues
 pietmichal
·
4Comments
pietmichal
·
4Comments
 hashlin
·
4Comments
hashlin
·
4Comments
 ericbiewener
·
4Comments
ericbiewener
·
4Comments
 majelbstoat
·
4Comments
majelbstoat
·
4Comments
 patrys
·
3Comments
patrys
·
3Comments
Most helpful comment
@jbaxleyiii Tested your branch on my project and performance improved significantly. Not sure how I got the 40s number before, but on 2.17.4 I'm seeing ~21s after several runs and ~23s with your branch.