 inerc
inerc
All 7 comments
Hi, could you please provide a test case?
 queerviolet
on 21 Jan 2020
queerviolet
on 21 Jan 2020
I don't see how there is anything to reproduce here. We almost certainly don't want to be pretty printing JSON bodies in production.
 msoule-cb
on 18 Feb 2020
msoule-cb
on 18 Feb 2020
Despite its name, the entirety of the prettyJSONStringify function is:
...where the value passed to it is the result of GraphQL execution — a native JavaScript data structure which needs to be serialized before being sent over the wire.
Since JSON is a subset of JavaScript itself and JSON.stringify calls the underlying C++ implementation, it's about as fast as it's ever going to get in terms of what it accomplishes. In fact, if any substantial amount of time is being spent in JSON.stringify, the response object is likely going to be incredibly large (in terms of bytes) — which is something else that should certainly not be happening in production!
In terms of opportunities to improve performance here, if Apollo Server were able to identify with precision that an already JSON.stringify'd response from a previous request could be re-used, then we could bypass this serialization and re-use the string from a previous response. In practice, that's not all that common and caching techniques here may very well cause additional performance hits.
Still, since use-cases vary, Apollo Server offers recommendations on how to accomplish exactly this using much more powerful industry-standard techniques which leverage @cacheControl directives combined with CDNs, Cache-control headers, and our full-response response cache which supports Redis/Memcached. This is all documented in our caching article, if you're interested.
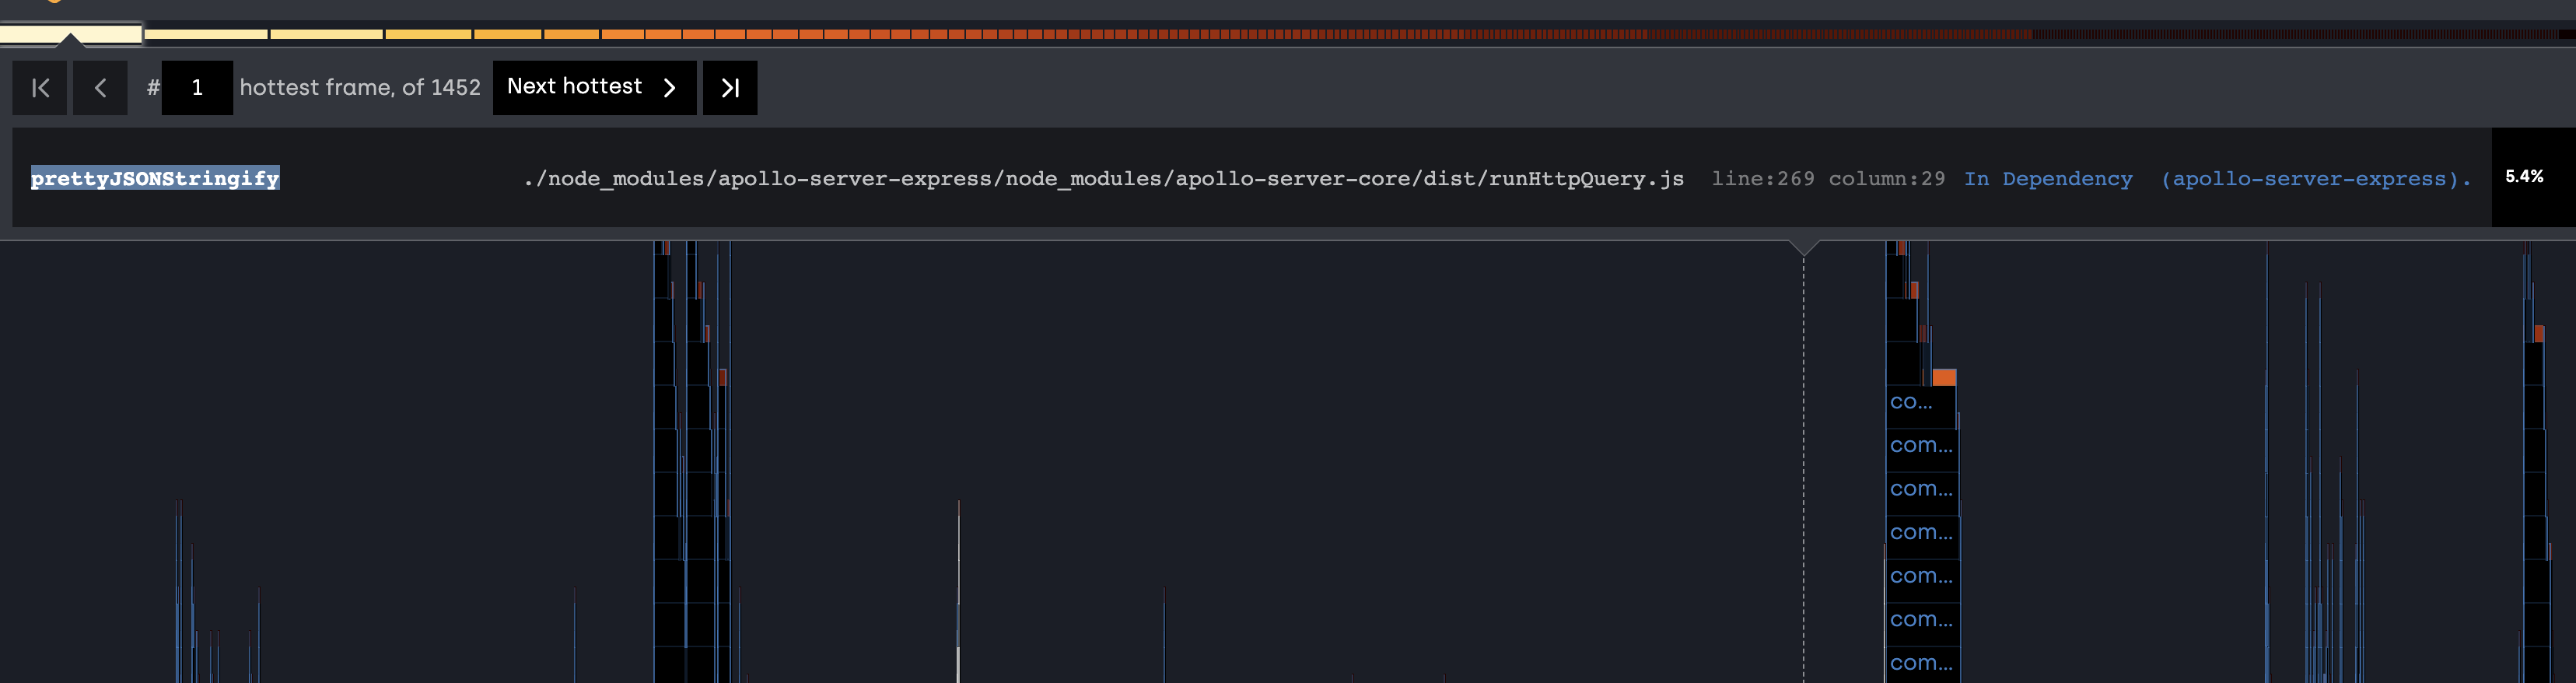
In terms of the the request for a reproduction: that's a simple and necessary formality of reporting issues with open-source software and is even more important for claims of memory leaks. In the case of this issue, this issue — which is claiming there is a memory leak — was opened with a screenshot of a _CPU flame chart_ with the X-axis time cropped off (zoomed into an unknown precision — is this microseconds?) and no explanation of the circumstances / shape of the query / size of the response / etc. To be honest, I'm not even sure why you'd comment on this issue agreeing with the problem and dismissing the necessity of a reproduction. If this issue highlights something you're actually experiencing, understanding the details — by means of reproduction steps — is really useful in prescribing a solution or declaring a bug.
Ultimately, time spent in CPU cycles does not correlate to a memory leak and time spent serializing a native JSON object into a string is unlikely to get any faster. _Nothing provided in this issue indicates a leak is present._ So, yes, a reproduction is absolutely necessary to diagnose any such leak and to proceed.
I doubt the addition of the newline is affecting much.
 abernix
on 18 Feb 2020
abernix
on 18 Feb 2020
OP is wrong about the memory leak but right about prettyJSONStringify being a hot spot for eventLoop blocking. Is streaming the JSON possible? Per https://nodejs.org/uk/docs/guides/dont-block-the-event-loop/#blocking-the-event-loop-json-dos
msoule-cb
on 18 Feb 2020
Reproduction steps with Node Clinic:
npm install -g clinicclinic flame --collect-only -- <start graph server>(I start graph server withnode ./dist/app.js)- Run load testing using autocannon, ab, or any other tool of choice.
- Stop graph server.
clinic flame --visualize-only .clinic/<pid>.clinic-flame(printed when stopped graph server) - View the
.clinic/<pid>.clinic-flame.htmlfile and note that prettyJSONStringify appears as a hot spot.
source: https://clinicjs.org/documentation/flame/03-first-analysis/
Alternatively with Chrome dev tools:
- Start graph server with
--inspectlikenode --inspect ./dist/app.js. - Nagivate to
chrome://inspect. The server should appear as an available target. - Start recording.
- Run load testing using autocannon, ab, or any other tool of choice.
- Stop recording.
- Note that prettyJSONStringify is a relatively heavy function.
source: https://nodejs.org/de/docs/guides/debugging-getting-started/
msoule-cb
on 18 Feb 2020
Sure JSON.stringify will chew up the event loop with enormous payloads, as I noted above:
if any substantial amount of time is being spent in
JSON.stringify, the response object is likely going to be incredibly large (in terms of bytes) — which is something else that should certainly not be happening in production!
I'm certainly curious about pursuing JSON streams in the future but if you are, as you're suggesting, returning multi-megabyte (50mB? As Node.js blog you link to postulates?) GraphQL responses to clients, giving you the ability to do that more effortlessly at this stage in the stack by streaming the JSON response is likely overlooking many other considerations in the stack that will be affected similarly. The client needing to deal with that payload is but one example, but juggling payloads of that size internally or sending them to clients is likely to result in a lot of other problems in the stack.
Your reproduction still glosses over the most important part of the reproduction — demonstrating the multi-megabyte response that actually turns that event-loop blocking into a larger problem:
explanation of the circumstances / shape of the query / size of the response / etc.
... or in other words: use-cases to better understand the needs and to suggest solutions. Merely zooming in on a particular frame that appears heavy on a server of unspecified complexity (e.g. "Start graph server", in your reproduction) isn't helpful. Any tool could highlight this frame in a relative sense as "hot", but there are a lot of other CPU-intensive spans in most GraphQL flamegraphs I've seen which make sense to target prior to this in terms of gaining performance boosts. Just the mere notion of blocking the event loop is not something that will be entirely avoidable and we're not going to prioritize a hand-wavy claims of the sort.
Please feel free to open a new issue with your reproduction, but don't do that before ensuring you've also included an explanation that justifies the need to send such heavy payloads, and how you've considered their effect on the entirety of the stack prior to blaming this one function.
If this is something you're actively struggling with, then you're in a prime position to consider how to solve it. I just ask that you surface your experience and everything that you're considering and demonstrate your aptitude and willingness to solve it by providing concrete and thoughtful research into the topic.
abernix
on 19 Feb 2020
Thanks for your response. Just to make sure I'm not barking up the wrong tree. What is considered a heavy payload? 1 MB? 512 KB? 256 KB?
And what would you consider high throughput? 10 requests/s? 100 requests/s?
msoule-cb
on 19 Feb 2020
Related issues
 dbrrt
·
3Comments
dbrrt
·
3Comments
 bchehraz
·
3Comments
bchehraz
·
3Comments
 leinue
·
3Comments
leinue
·
3Comments
 espoal
·
3Comments
espoal
·
3Comments
 veeramarni
·
3Comments
veeramarni
·
3Comments