Apollo-module: Memory leak with Smart Query
Version
Reproduction link
https://codesandbox.io/s/nuxt-apollo-smart-query-bug-v585k
Steps to reproduce
- Install apollo-module for Nuxt;
- Use a Smart query in a page.
What is expected ?
The GarbageCollector can free up the memory after every page reload.
What is actually happening?
Visiting pages with Smart query cause the memory to continue to grow up without stopping.
After ~ 15000 urls (depends on how much HTML there is in page) the server is out of memory.
Additional comments?
Using apolloProvider.defaultClient.query in asyncData it's ok.
There's a library installed in the demo to bulk-test urls, 'npm run siege'. With that it's possible to see the memory growing up.
 LuXDAmore
All 24 comments
I'll try to invest on this, but I'm not pretty sure what i can do :(
Have you try with vue-apollo and vue without using nuxt?
I don't know if it belong to vue-apollo or just only this module.
If you know how to fix this issue, feel free to make a PR.
 kieusonlam
on 25 Jun 2019
kieusonlam
on 25 Jun 2019
I haven't tried because the problem occurs when i'm in a ssr-environment (tested w/ Nuxt)..
Is the node-server that goes out-of-memory.
LuXDAmore
on 4 Sep 2019
I use a lot of smart query in my nuxt app. It's not in production stage but we are in pre-release and I can see memory leak in the digital ocean graphs:
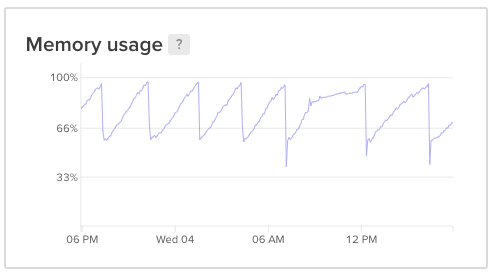
There is only nuxt in this droplet.
Also, There is something strange. It's seem smart query are called two times in SSR and one more in front. If I do that:
import Post from '~/apollo/queries/Post' // Post.gql file

export default {
apollo: {
    post: {
        query() {
           console.log('Post', Post)
           return Post
        }
    }
...
In the terminal and the devtools console, each one show two logs (devtools with nuxt:ssr tag) like if the query function is called twice. In devtools console, there is also one more log wihtout nuxt:ssr tag like if the query is called one more time in front. I think this last is normal, but there is no reason for two times in SSR...
Edit: I forked @LuXDAmore codesandbox here: https://codesandbox.io/s/nuxt-apollo-smart-query-bug-7p7ni
 ManUtopiK
on 4 Sep 2019
ManUtopiK
on 4 Sep 2019
It's look like a lot of things is happening here.

and most of them seem to be nuxt plugin create new instance everytime someone make the request to the server.
I'm not sure how to solve this problem at the moment. If anyone have a idea, PR are wellcome.
kieusonlam
on 12 Sep 2019
@Atinux Can you help me with this? I think this is happen to another package as well https://github.com/algolia/vue-instantsearch/issues/685
kieusonlam
on 13 Sep 2019
_It's "funny" because it's another one issue opened by me_ 😄
However, if these can help, i've tried to remove cache from Apollo, by setting:
new InMemoryCache(
    {
        resultCaching: false,
        freezeResults: true,
    }
)
and
assumeImmutableResults: true
and
defaultOptions: {
    $watchQuery: {
        fetchPolicy: 'no-cache',  // and 'cache-first'
    },
    $query: {
        fetchPolicy: 'no-cache',  // and 'cache-first'
    },
},
I did a lot of tests, but I couldn't find a solution.
_IDK: Maybe, this behavior could be related to this too? nuxt-community/apollo-module#251_
@Atinux Can you help me with this? I think it happen to another package as well algolia/vue-instantsearch#685
LuXDAmore
on 13 Sep 2019
@manniL Can you help us with this? Or do you have some advice for us?
LuXDAmore
on 30 Sep 2019
@ManUtopiK in that chart, that dips after mem fill up is app crash and restart or just gc ?
 aldarund
on 8 Oct 2019
aldarund
on 8 Oct 2019
Does this happen only with Nuxt or also within a vue-cli project?
 pimlie
on 10 Oct 2019
pimlie
on 10 Oct 2019
@aldarund What's do you mean by gc?
Nuxt is running under a pm2 so it's reload each time memory is full. I can see how many times it was reloaded with pm2 ls.
Also, I forgot to say that nuxt is running in dev mode (npm run dev). It's not in production now.
ManUtopiK
on 10 Oct 2019
In dev mode, memory leaks are unavoidable due to various issues. These are usually not present in prod!
 manniL
on 10 Oct 2019
manniL
on 10 Oct 2019
I have the same issue in Production. Visiting pages causes memory to continue to grow without stopping.
 seandelaney
on 10 Oct 2019
seandelaney
on 10 Oct 2019
@LuXDAmore @seandelaney
As @pimlie already asked: Does that happen with the vue-cli project + it's apollo service too?
manniL
on 11 Oct 2019
I'm only using the @nuxtjs/apollo module.
I've not got any projects with vue-cli + vue-apollo
seandelaney
on 11 Oct 2019
Not sure if this helps, but based on my latest debugging and testing, I think the memory leak is within/related to the Apollo Provider and how the Apollo Client instances are created and not tearing down after each request.
I say this because within my Nuxt project, if I create my own Apollo Client instance in a Vue component (nothing to do with SSR) and make a call to GraphQL endpoint, the request works as expected and everything seems fine. I destroy my instance at the end:
My custom ApolloClient class:
import { ApolloClient } from 'apollo-client'
import { createHttpLink } from 'apollo-link-http'
import { InMemoryCache } from 'apollo-cache-inmemory'

export default class {
  constructor({ token, schema }) {
    // HTTP connection to the API
    const link = createHttpLink({
      uri: `${process.env.API_URL}${schema}`,
      headers: {
        authorization: `Bearer ${token}`,
      },
    })

    // Cache implementation
    const cache = new InMemoryCache()

    // Create the apollo client
    return new ApolloClient({
      link,
      cache,
    })
  }
}
I call it like so:
let apolloClient = new ApolloClient({
    token,
    schema,
})

...

apolloClient.query({
    query: require('~/apollo/schemas/some.gql'),
    fetchPolicy: 'no-cache',
})

apolloClient = null
Thats my current workaround to prevent our production server (Heroku with 8 Dyno's) from running out of memory every few hours. Our Nuxt web app isn't that big but gets a lot of traffic so any help to get these memory leaks fixed would be grateful.
seandelaney
on 11 Oct 2019
@LuXDAmore @seandelaney
As @pimlie already asked: Does that happen with the vue-cli project + it's apollo service too?
I found this problem both in 'production' and in 'development'.
I'm using the apollo-module by nuxt..
I don't know if it's related, but i've also encountered that using a query in a middle-ware, and passing it down to the asyncData by having:
// middle-ware.js
export default async context => {

    const { app: { apolloProvider: { defaultClient: apollo }, } = context;
    const { data } = await apollo.query(...);

    context.KEY = data;

}
// page.vue
<template>
    <p v-text="KEY" />
</template>


md5-e5c7416fdf4d79d603dcf549347c7084
cause the HTML of the page to grow up.. I've opened an ISSUE here..
Example:
- first try, html's size [with the server just started]: ~ 200 KB;
- last try, after ~ 200 urls, html's size [same server]: ~ 60 MB.
_In the second one, i can see the payload of the oldest visited pages present in the html_
Using apollo.cache.data.clear(); before await apollo.query(...); solve this problem, but idk if it's the right way to handle this.
LuXDAmore
on 14 Oct 2019
Does someone has a runnable minimal reproduction so I can take a look?
 Akryum
on 20 Oct 2019
Akryum
on 20 Oct 2019
@Akryum I've posted this, a couple of month ago.. You can download the repo, start it in dev-mode (or prod) and then there is a script npm run siege to _stress_ the server.. Try this 2 or 3 times (and take a look at the GC)..
You can also change values in the siege/siege.js file.
LuXDAmore
on 21 Oct 2019
Before:

After:

Akryum
on 21 Oct 2019
@Akryum Great job! Thanks.
kieusonlam
on 21 Oct 2019
@Akryum you are the man 👍
 dohomi
on 21 Oct 2019
dohomi
on 21 Oct 2019
I've just updated to latest version of this package. Currently running tests.
seandelaney
on 21 Oct 2019
@Akryum - Thanks so much! I've watched our production graphs today and can confirm this has removed the sawtooth pattern we'd been seeing before, where memory would ramp up and then we'd restart the app. Much appreciated 👍
 jesseschutt
on 21 Oct 2019
jesseschutt
on 21 Oct 2019
Can you tell where we implemented the fix in this pr? 😆

jesseschutt
on 22 Oct 2019
Related issues
 wan2land
·
8Comments
wan2land
·
8Comments
 Billybobbonnet
·
4Comments
dohomi
·
4Comments
Billybobbonnet
·
4Comments
dohomi
·
4Comments
 lindesvard
·
7Comments
lindesvard
·
7Comments
 dmitryyankowski
·
9Comments
dmitryyankowski
·
9Comments
Most helpful comment
Before:
After: