Apm-agent-dotnet: Elasticsearch operations produce span retrieve error in distributed transactions
Describe the bug
Hi,
I didn't notice this with previous versions of APM, but right know if I create a manual transaction with an existing distributed tracing id with inner spans, on each Elasticsearch (Nest lib) I get the following errors from APM like
Failed to find current span in ConcurrentDictionary
To Reproduce
Steps to reproduce the behavior:
1.My use case is the following : App1 is publishing a message to Kafka, in the message I set a distributed correlationId
using the following :
        public static string GetCorrelationLogsId() =>
                (Agent.Tracer.CurrentSpan?.OutgoingDistributedTracingData
                    ?? Agent.Tracer.CurrentTransaction?.OutgoingDistributedTracingData)?.SerializeToString();
Let's say the string returned is 00-67fe36868e7ce8498bc0195b3a0acb4f-f867f0376eec7a49-01, it's then set into the message before sending it to Kafka.
- Then
App2is consuming the message, and use the correlationId to open a new manual transaction
            await Agent.Tracer
              .CaptureTransaction("myTransaction", ApiConstants.SubtypeElasticsearch, async (t) =>
              {
                      ... some code
                      await t.CaptureSpan("PersistEntity", ApiConstants.SubtypeElasticsearch, async span =>
                      {
                          _logger.LogDebug("Persist entity in Elk with Id {id}", mymessage.Id);
                          await _elasticsearchRepository.Add(mymessage);  // produces errors !
                      });
                       ... some code
            }, DistributedTracingData.TryDeserializeFromString(mymessage.DistributedTracingData));  // 00-67fe36868e7ce8498bc0195b3a0acb4f-f867f0376eec7a49-01
- The call of Elastic repository method produces the following logs
[07:51:17 INF] {RequestPipelineDiagnosticsListener} Received an CallElasticsearch.Start event from elasticsearch
[07:51:17 INF] {SerializerDiagnosticsListener} Received an Serialize.Start event from elasticsearch
[07:51:17 ERR] {SerializerDiagnosticsListener} Failed to find current span in ConcurrentDictionary 00-4b8a560b65e8ff4cb4f6e376f526c3ac-5fcbad25ebedd341-01
[07:51:17 INF] {HttpConnectionDiagnosticsListener} Received an SendAndReceiveHeaders.Start event from elasticsearch
[07:51:17 ERR] {HttpConnectionDiagnosticsListener} Failed to find current span in ConcurrentDictionary 00-4b8a560b65e8ff4cb4f6e376f526c3ac-5fcbad25ebedd341-01
[07:51:17 INF] {HttpConnectionDiagnosticsListener} Received an ReceiveBody.Start event from elasticsearch
[07:51:17 INF] {SerializerDiagnosticsListener} Received an Deserialize.Start event from elasticsearch
[07:51:17 ERR] {SerializerDiagnosticsListener} Failed to find current span in ConcurrentDictionary 00-4b8a560b65e8ff4cb4f6e376f526c3ac-dc31ed64b33f0145-01
[07:51:17 ERR] {HttpConnectionDiagnosticsListener} Failed to find current span in ConcurrentDictionary 00-4b8a560b65e8ff4cb4f6e376f526c3ac-5fcbad25ebedd341-01
[07:51:17 ERR] {RequestPipelineDiagnosticsListener} Failed to find current span in ConcurrentDictionary 00-4b8a560b65e8ff4cb4f6e376f526c3ac-302847dec737e94c-01
_=> the correlation id reported in logs are not the same as the one used to initiate the transaction (ie : transported in message payload)_
- The correlation Id seems to be correctly used thanks to the APM trace sample since both applications appear in the same transaction

Versions and config
Here are the current versions of used libs
    <TargetFramework>net5.0</TargetFramework>
    <PackageReference Include="Elastic.Apm.NetCoreAll" Version="1.7.1" />
    <PackageReference Include="Elastic.Apm.SerilogEnricher" Version="1.5.1" />
    <PackageReference Include="Elastic.CommonSchema.Serilog" Version="1.5.1" />
    <PackageReference Include="NEST" Version="7.10.1" />
And my appsettings.json
  "ElasticApm": {
    "ServerUrls": "http://apm:8200",
    "TransactionMaxSpans": 5000,
    "CaptureBody": "all",
    "CloudProvider": "none"
  }
Expected behavior
I expect no error from APM or to understand what I did wrong
 NicolasReyDotNet
All 20 comments
The log error message is coming from
Spans are keyed against Activity.Current.Id in the concurrent dictionary; I'm not sure how the interaction of a set DistributedTracingData plays or should play into this. @gregkalapos, thoughts?
 russcam
on 17 Dec 2020
russcam
on 17 Dec 2020
@russcam @gregkalapos
I made other tests, the problem appears in each combination (with/without previous distributed id and with/without inner span)
what ever the used version (1.7.1, 1.7.0, 1.6.x)
Solution
Well after looking at my recent commit, the problem seems to come from NEST library
switching from :
<PackageReference Include="NEST" Version="7.10.1" />
to
<PackageReference Include="NEST" Version="7.10.0" />
remove all console error...
I don't know If you would like me to create an Issue an Nest repo or if you prefer take the point directlty as it's part of the same 'elastic" organization ?
Hope it helps
For information : Example for APM v1.7.1 and NEST 7.10.1
distributed tracing data with inner span
            await Agent.Tracer
              .CaptureTransaction($"{methodName}Transaction", ApiConstants.SubtypeElasticsearch, async (t) =>
              {
                  try
                  {
                      // The object to be persisted to Elk
                      OrderNotification orderAssignmentNotification = orderAssignmentMessage.Payload;

                      await t.CaptureSpan("PersistEntity", ApiConstants.SubtypeElasticsearch, async span =>
                      {
                          _logger.LogInformation("TEST with distributed tracing data with inner span - id {dsitributedId}", orderAssignmentMessage.DistributedTracingData);
                          await _orderAssignmentNotificationRepository.Add(orderAssignmentNotification);
                      });
                  }
                  catch (Exception e)
                  {
                      ;
                  }
              }, DistributedTracingData.TryDeserializeFromString(orderAssignmentMessage.DistributedTracingData));
[08:35:57 INF] TEST with distributed tracing data with inner span - id 00-54d3653cd592b340b9b9d3135d8326b9-8ef2b39d30c93a4f-01
[08:36:06 INF] {RequestPipelineDiagnosticsListener} Received an CallElasticsearch.Start event from elasticsearch
[08:36:06 INF] {SerializerDiagnosticsListener} Received an Serialize.Start event from elasticsearch
[08:36:06 ERR] {SerializerDiagnosticsListener} Failed to find current span in ConcurrentDictionary 00-9313f64edf47864aa581e6fc7db56fdb-a9674ccbfc949246-01
[08:36:06 INF] {HttpConnectionDiagnosticsListener} Received an SendAndReceiveHeaders.Start event from elasticsearch
[08:36:06 ERR] {HttpConnectionDiagnosticsListener} Failed to find current span in ConcurrentDictionary 00-9313f64edf47864aa581e6fc7db56fdb-a9674ccbfc949246-01
[08:36:06 INF] {HttpConnectionDiagnosticsListener} Received an ReceiveBody.Start event from elasticsearch
[08:36:06 INF] {SerializerDiagnosticsListener} Received an Deserialize.Start event from elasticsearch
[08:36:06 ERR] {SerializerDiagnosticsListener} Failed to find current span in ConcurrentDictionary 00-9313f64edf47864aa581e6fc7db56fdb-7456557de6f6754c-01
[08:36:06 ERR] {HttpConnectionDiagnosticsListener} Failed to find current span in ConcurrentDictionary 00-9313f64edf47864aa581e6fc7db56fdb-a9674ccbfc949246-01
[08:36:06 ERR] {RequestPipelineDiagnosticsListener} Failed to find current span in ConcurrentDictionary 00-9313f64edf47864aa581e6fc7db56fdb-58bc3e8d21809748-01


md5-9db722d4dda2bca82009ee091619fc73


           await Agent.Tracer
              .CaptureTransaction($"{methodName}Transaction", ApiConstants.SubtypeElasticsearch, async (t) =>
              {
                  try
                  {
                      // The object to be persisted to Elk
                      OrderNotification orderAssignmentNotification = orderAssignmentMessage.Payload;

                      _logger.LogInformation("TEST with distributed tracing data without any inner span - id {dsitributedId}", orderAssignmentMessage.DistributedTracingData);
                      await _orderAssignmentNotificationRepository.Add(orderAssignmentNotification);
                  }
                  catch (Exception e)
                  {
                      ;
                  }
              }, DistributedTracingData.TryDeserializeFromString(orderAssignmentMessage.DistributedTracingData));


md5-8da7c6e91c60aa3fb1b3312942d9ef51


[08:36:06 INF] TEST with distributed tracing data without any inner span - id 00-54d3653cd592b340b9b9d3135d8326b9-8ef2b39d30c93a4f-01
[08:36:08 INF] {RequestPipelineDiagnosticsListener} Received an CallElasticsearch.Start event from elasticsearch
[08:36:08 INF] {SerializerDiagnosticsListener} Received an Serialize.Start event from elasticsearch
[08:36:08 ERR] {SerializerDiagnosticsListener} Failed to find current span in ConcurrentDictionary 00-9313f64edf47864aa581e6fc7db56fdb-0c405509a26a7743-01
[08:36:08 INF] {HttpConnectionDiagnosticsListener} Received an SendAndReceiveHeaders.Start event from elasticsearch
[08:36:08 ERR] {HttpConnectionDiagnosticsListener} Failed to find current span in ConcurrentDictionary 00-9313f64edf47864aa581e6fc7db56fdb-0c405509a26a7743-01
[08:36:08 INF] {HttpConnectionDiagnosticsListener} Received an ReceiveBody.Start event from elasticsearch
[08:36:08 INF] {SerializerDiagnosticsListener} Received an Deserialize.Start event from elasticsearch
[08:36:08 ERR] {SerializerDiagnosticsListener} Failed to find current span in ConcurrentDictionary 00-9313f64edf47864aa581e6fc7db56fdb-ef0f3cde5a445647-01
[08:36:08 ERR] {HttpConnectionDiagnosticsListener} Failed to find current span in ConcurrentDictionary 00-9313f64edf47864aa581e6fc7db56fdb-0c405509a26a7743-01
[08:36:08 ERR] {RequestPipelineDiagnosticsListener} Failed to find current span in ConcurrentDictionary 00-9313f64edf47864aa581e6fc7db56fdb-bada1f3a7fecdf49-01


md5-c3c8f69c89ec7802c0a443e814633785


            await Agent.Tracer
          .CaptureTransaction($"{methodName}Transaction", ApiConstants.SubtypeElasticsearch, async (t) =>
          {
              try
              {
                    // The object to be persisted to Elk
                    OrderNotification orderAssignmentNotification = orderAssignmentMessage.Payload;

                  await t.CaptureSpan("PersistEntity", ApiConstants.SubtypeElasticsearch, async span =>
                  {
                      _logger.LogInformation("TEST without any distributed tracing data");
                      await _orderAssignmentNotificationRepository.Add(orderAssignmentNotification);
                  });
              }
              catch (Exception e)
              {
                  ;
              }
          });


md5-8da7c6e91c60aa3fb1b3312942d9ef51


[08:36:14 INF] TEST without any distributed tracing data
[08:36:17 INF] {RequestPipelineDiagnosticsListener} Received an CallElasticsearch.Start event from elasticsearch
[08:36:17 INF] {SerializerDiagnosticsListener} Received an Serialize.Start event from elasticsearch
[08:36:17 ERR] {SerializerDiagnosticsListener} Failed to find current span in ConcurrentDictionary 00-9313f64edf47864aa581e6fc7db56fdb-1f542864cc8bd549-01
[08:36:17 INF] {HttpConnectionDiagnosticsListener} Received an SendAndReceiveHeaders.Start event from elasticsearch
[08:36:17 ERR] {HttpConnectionDiagnosticsListener} Failed to find current span in ConcurrentDictionary 00-9313f64edf47864aa581e6fc7db56fdb-1f542864cc8bd549-01
[08:36:17 INF] {HttpConnectionDiagnosticsListener} Received an ReceiveBody.Start event from elasticsearch
[08:36:17 INF] {SerializerDiagnosticsListener} Received an Deserialize.Start event from elasticsearch
[08:36:17 ERR] {SerializerDiagnosticsListener} Failed to find current span in ConcurrentDictionary 00-9313f64edf47864aa581e6fc7db56fdb-73e2b13c43e7c241-01
[08:36:17 ERR] {HttpConnectionDiagnosticsListener} Failed to find current span in ConcurrentDictionary 00-9313f64edf47864aa581e6fc7db56fdb-1f542864cc8bd549-01
[08:36:17 ERR] {RequestPipelineDiagnosticsListener} Failed to find current span in ConcurrentDictionary 00-9313f64edf47864aa581e6fc7db56fdb-bc69ea88c223d54e-01


md5-2ebb9751c08d73e81211ad06699c6641


            await Agent.Tracer
          .CaptureTransaction($"{methodName}Transaction", ApiConstants.SubtypeElasticsearch, async (t) =>
          {
              try
              {
                  // The object to be persisted to Elk
                  OrderNotification orderAssignmentNotification = orderAssignmentMessage.Payload;

                  _logger.LogInformation("TEST without any distributed tracing data and without any inner span");
                  await _orderAssignmentNotificationRepository.Add(orderAssignmentNotification);
              }
              catch (Exception e)
              {
                  ;
              }
          });


md5-8da7c6e91c60aa3fb1b3312942d9ef51


[08:36:19 INF] TEST without any distributed tracing data and without any inner span
[08:36:20 INF] {RequestPipelineDiagnosticsListener} Received an CallElasticsearch.Start event from elasticsearch
[08:36:20 INF] {SerializerDiagnosticsListener} Received an Serialize.Start event from elasticsearch
[08:36:20 ERR] {SerializerDiagnosticsListener} Failed to find current span in ConcurrentDictionary 00-9313f64edf47864aa581e6fc7db56fdb-03bf0b2e350d3949-01
[08:36:20 INF] {HttpConnectionDiagnosticsListener} Received an SendAndReceiveHeaders.Start event from elasticsearch
[08:36:20 ERR] {HttpConnectionDiagnosticsListener} Failed to find current span in ConcurrentDictionary 00-9313f64edf47864aa581e6fc7db56fdb-03bf0b2e350d3949-01
[08:36:20 INF] {HttpConnectionDiagnosticsListener} Received an ReceiveBody.Start event from elasticsearch
[08:36:20 INF] {SerializerDiagnosticsListener} Received an Deserialize.Start event from elasticsearch
[08:36:20 ERR] {SerializerDiagnosticsListener} Failed to find current span in ConcurrentDictionary 00-9313f64edf47864aa581e6fc7db56fdb-d9e51c492df41d4e-01
[08:36:20 ERR] {HttpConnectionDiagnosticsListener} Failed to find current span in ConcurrentDictionary 00-9313f64edf47864aa581e6fc7db56fdb-03bf0b2e350d3949-01
[08:36:20 ERR] {RequestPipelineDiagnosticsListener} Failed to find current span in ConcurrentDictionary 00-9313f64edf47864aa581e6fc7db56fdb-33c172bf33fa6948-01
@NicolasReyDotNet I _think_ this might possibly be related to differing versions of System.Diagnostics.DiagnosticSource.
In Elasticsearch.Net updated to System.Diagnostics.DiagnosticSource 5.0.0 in 7.10.1. Elastic.Apm updated to System.Diagnostics.DiagnosticSource 5.0.0 in 1.7.0 , What version of System.Diagnostics.DiagnosticSource is referenced in the application i.e. what assembly version is Activity found in?
russcam
on 4 Jan 2021
@russcam
I use the following version
<PackageReference Include="System.Diagnostics.DiagnosticSource" Version="5.0.0" />
Do you want me to make some tests about it ?
NicolasReyDotNet
on 4 Jan 2021
@NicolasReyDotNet if you have a test application that reproduces the issue that you can share, that would be really helpful. Are both NEST and Elasticsearch.Net on version 7.10.0?
russcam
on 11 Jan 2021
I am getting this using the standard ASPNet client whenever I do JQuery AJAX requests on an MVC webapp on .Net CORE 3.1.
 uni4online
on 12 Jan 2021
uni4online
on 12 Jan 2021
@NicolasReyDotNet if you have a test application that reproduces the issue that you can share, that would be really helpful. Are both NEST and Elasticsearch.Net on version 7.10.0?
@russcam
Here is the test application that reproduces the issue
https://github.com/NicolasReyDotNet/APMSpanErrorRepro
The version of packages are
   <PackageReference Include="Elastic.Apm.NetCoreAll" Version="1.7.1" />
    <PackageReference Include="Elastic.Apm.SerilogEnricher" Version="1.5.1" />
    <PackageReference Include="Elastic.CommonSchema.Serilog" Version="1.5.1" />
    <PackageReference Include="Microsoft.VisualStudio.Azure.Containers.Tools.Targets" Version="1.10.9" />
    <PackageReference Include="NEST" Version="7.10.1" />
I don't use the package Elasticsearch.Net, should I ? Maybe it's the main problem ?
When using
<PackageReference Include="NEST" Version="7.10.1" />
I got the errors in logs and nothing is reported to APM, except the WeatherForecast/Get which acts as control here :
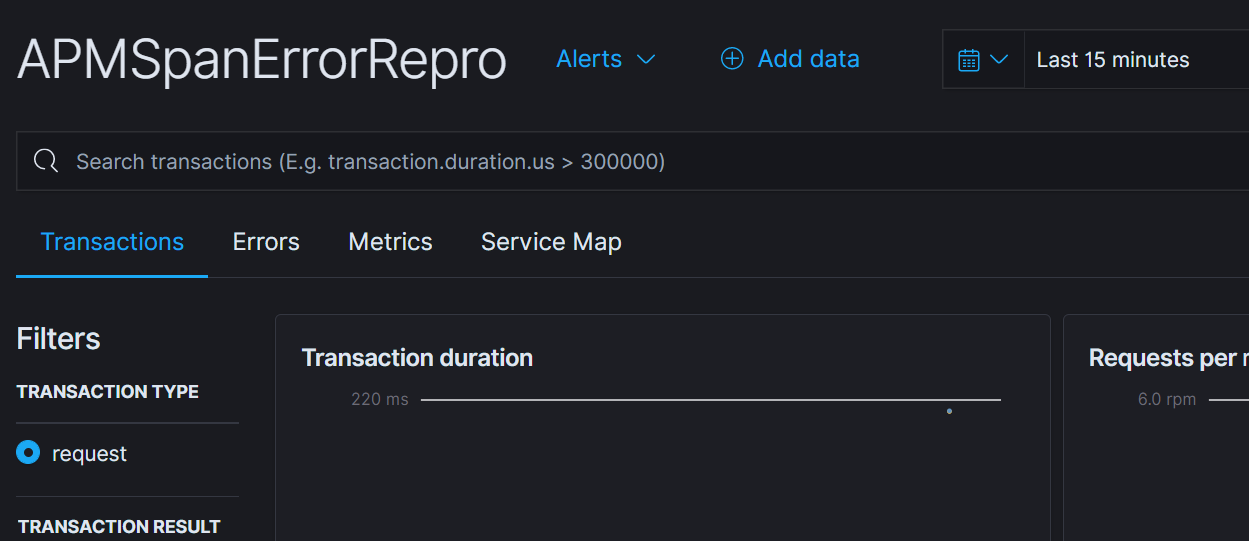

When using
<PackageReference Include="NEST" Version="7.10.0" />
I got no log error and transactions are reported to APM as expected


NicolasReyDotNet
on 13 Jan 2021
Running into this issue. It's spitting out tons of errors.
 ejsmith
on 29 Jan 2021
ejsmith
on 29 Jan 2021
@russcam
Could you reproduce the problem with my repo ?
 NicolasREY69330
on 29 Jan 2021
NicolasREY69330
on 29 Jan 2021
This has become unbearable, my logs are getting flooded. Guess I'm going to have to stop using this APM client.
ejsmith
on 2 Feb 2021
@ejsmith
Do you use Nest lib as well ? If so sticking from 7.10.0 instead of 7.10.1 solves the problem for you as it temporarily solves it for me ?
NicolasREY69330
on 2 Feb 2021
Yes I do. I tried that today and it didn't help. I need to verify that NuGet didn't somehow bump the dependency up.
ejsmith
on 2 Feb 2021
Sure , if you use docker you may want to clean and rebuild your app to avoir any nuget lib cache, it was the case for me
NicolasREY69330
on 2 Feb 2021
Thank you for the repro @NicolasReyDotNet, I can reproduce the issue. Looking into
russcam
on 16 Feb 2021
@russcam you're welcome, thanks to you
NicolasREY69330
on 16 Feb 2021
I've opened https://github.com/elastic/elasticsearch-net/pull/5326 to address.
I've outlined the problem in the PR; it's a rather pernicious and subtle bug that was introduced when the clients were updated to System.Diagnostics.DiagnosticSource, and stems from Activity now implementing Dispose() and setting Activity.Current to the parent Activity on Dispose(), which ends up happening when the derived Diagnostic types in the client are disposed, and before it notifies any Diagnostic Listeners of the stopping of the activity that happens in the overridden Dispose(bool).
russcam
on 17 Feb 2021
The workaround for the moment would be to downgrade to NEST and Elasticsearch.Net 7.10.0
russcam
on 17 Feb 2021
Thank you for your help
NicolasREY69330
on 17 Feb 2021
@NicolasREY69330 - We've just pushed packages for 7.11.1 which include a fix for this bug.
 stevejgordon
on 17 Feb 2021
stevejgordon
on 17 Feb 2021
I've opened a PR #1186 to update the Elasticsearch sample to use 7.11.1, and add a note to the docs to update from 7.10.1 and 7.11.0 to at least 7.11.1.
I'm going to close this issue now as the underlying bug is resolved. For future folks that end up finding this issue, if you're experiencing this problem with NEST/Elasticsearch.Net 7.10.1 or 7.11.0, please upgrade to at least 7.11.1.
russcam
on 18 Feb 2021
Related issues
 lreuven
·
6Comments
lreuven
·
6Comments
 SergeyKleyman
·
8Comments
SergeyKleyman
·
8Comments
 fredeil
·
3Comments
fredeil
·
3Comments
 rcanpahali
·
3Comments
rcanpahali
·
3Comments
 vhatsura
·
4Comments
vhatsura
·
4Comments
Most helpful comment
@NicolasREY69330 - We've just pushed packages for 7.11.1 which include a fix for this bug.