Apm-agent-dotnet: When adding a label, the Span does not get sent
Description
When I add an entry to the Labels field inside the Span, then the whole span is not sent.
To Reproduce
I have the following code that wraps creating a span and adding a label:
    public class LogPerformance : ILogPerformance
    {
        public T CaptureSpan<T>(Func<T> func)
        {
            return Elastic.Apm.Agent.Tracer.CurrentTransaction.CaptureSpan(
                "spanName",
                "spanType",
                span =>
                {
                    span.Labels["foo"] = "bar";

                    return func();
                },
                "spanSubType");
        }
I expect to see the Span arrive in Kibana with that label, but it never arrives.
If I remove span.Labels["foo"] = "bar";, then there is no problem and it arrives.
No obvious exception or error message is observed.
 SteveDunn
All 19 comments
I'm unable to reproduce this with the following small sample:
```
internal class Program
{
public class LogPerformance
{
public T CaptureSpan
{
return Elastic.Apm.Agent.Tracer.CurrentTransaction.CaptureSpan(
"spanName",
"spanType",
span =>
{
span.Labels["foo"] = "bar";
                return func();
            },
            "spanSubType");
    }
}

private static void Main(string[] args)
{

    var transaction = Agent.Tracer.StartTransaction("aa", "bb");
    var logPerf = new LogPerformance();
    logPerf.CaptureSpan<int>(() => 1+1);

    transaction.End();

    Thread.Sleep(150000);
}
}
````
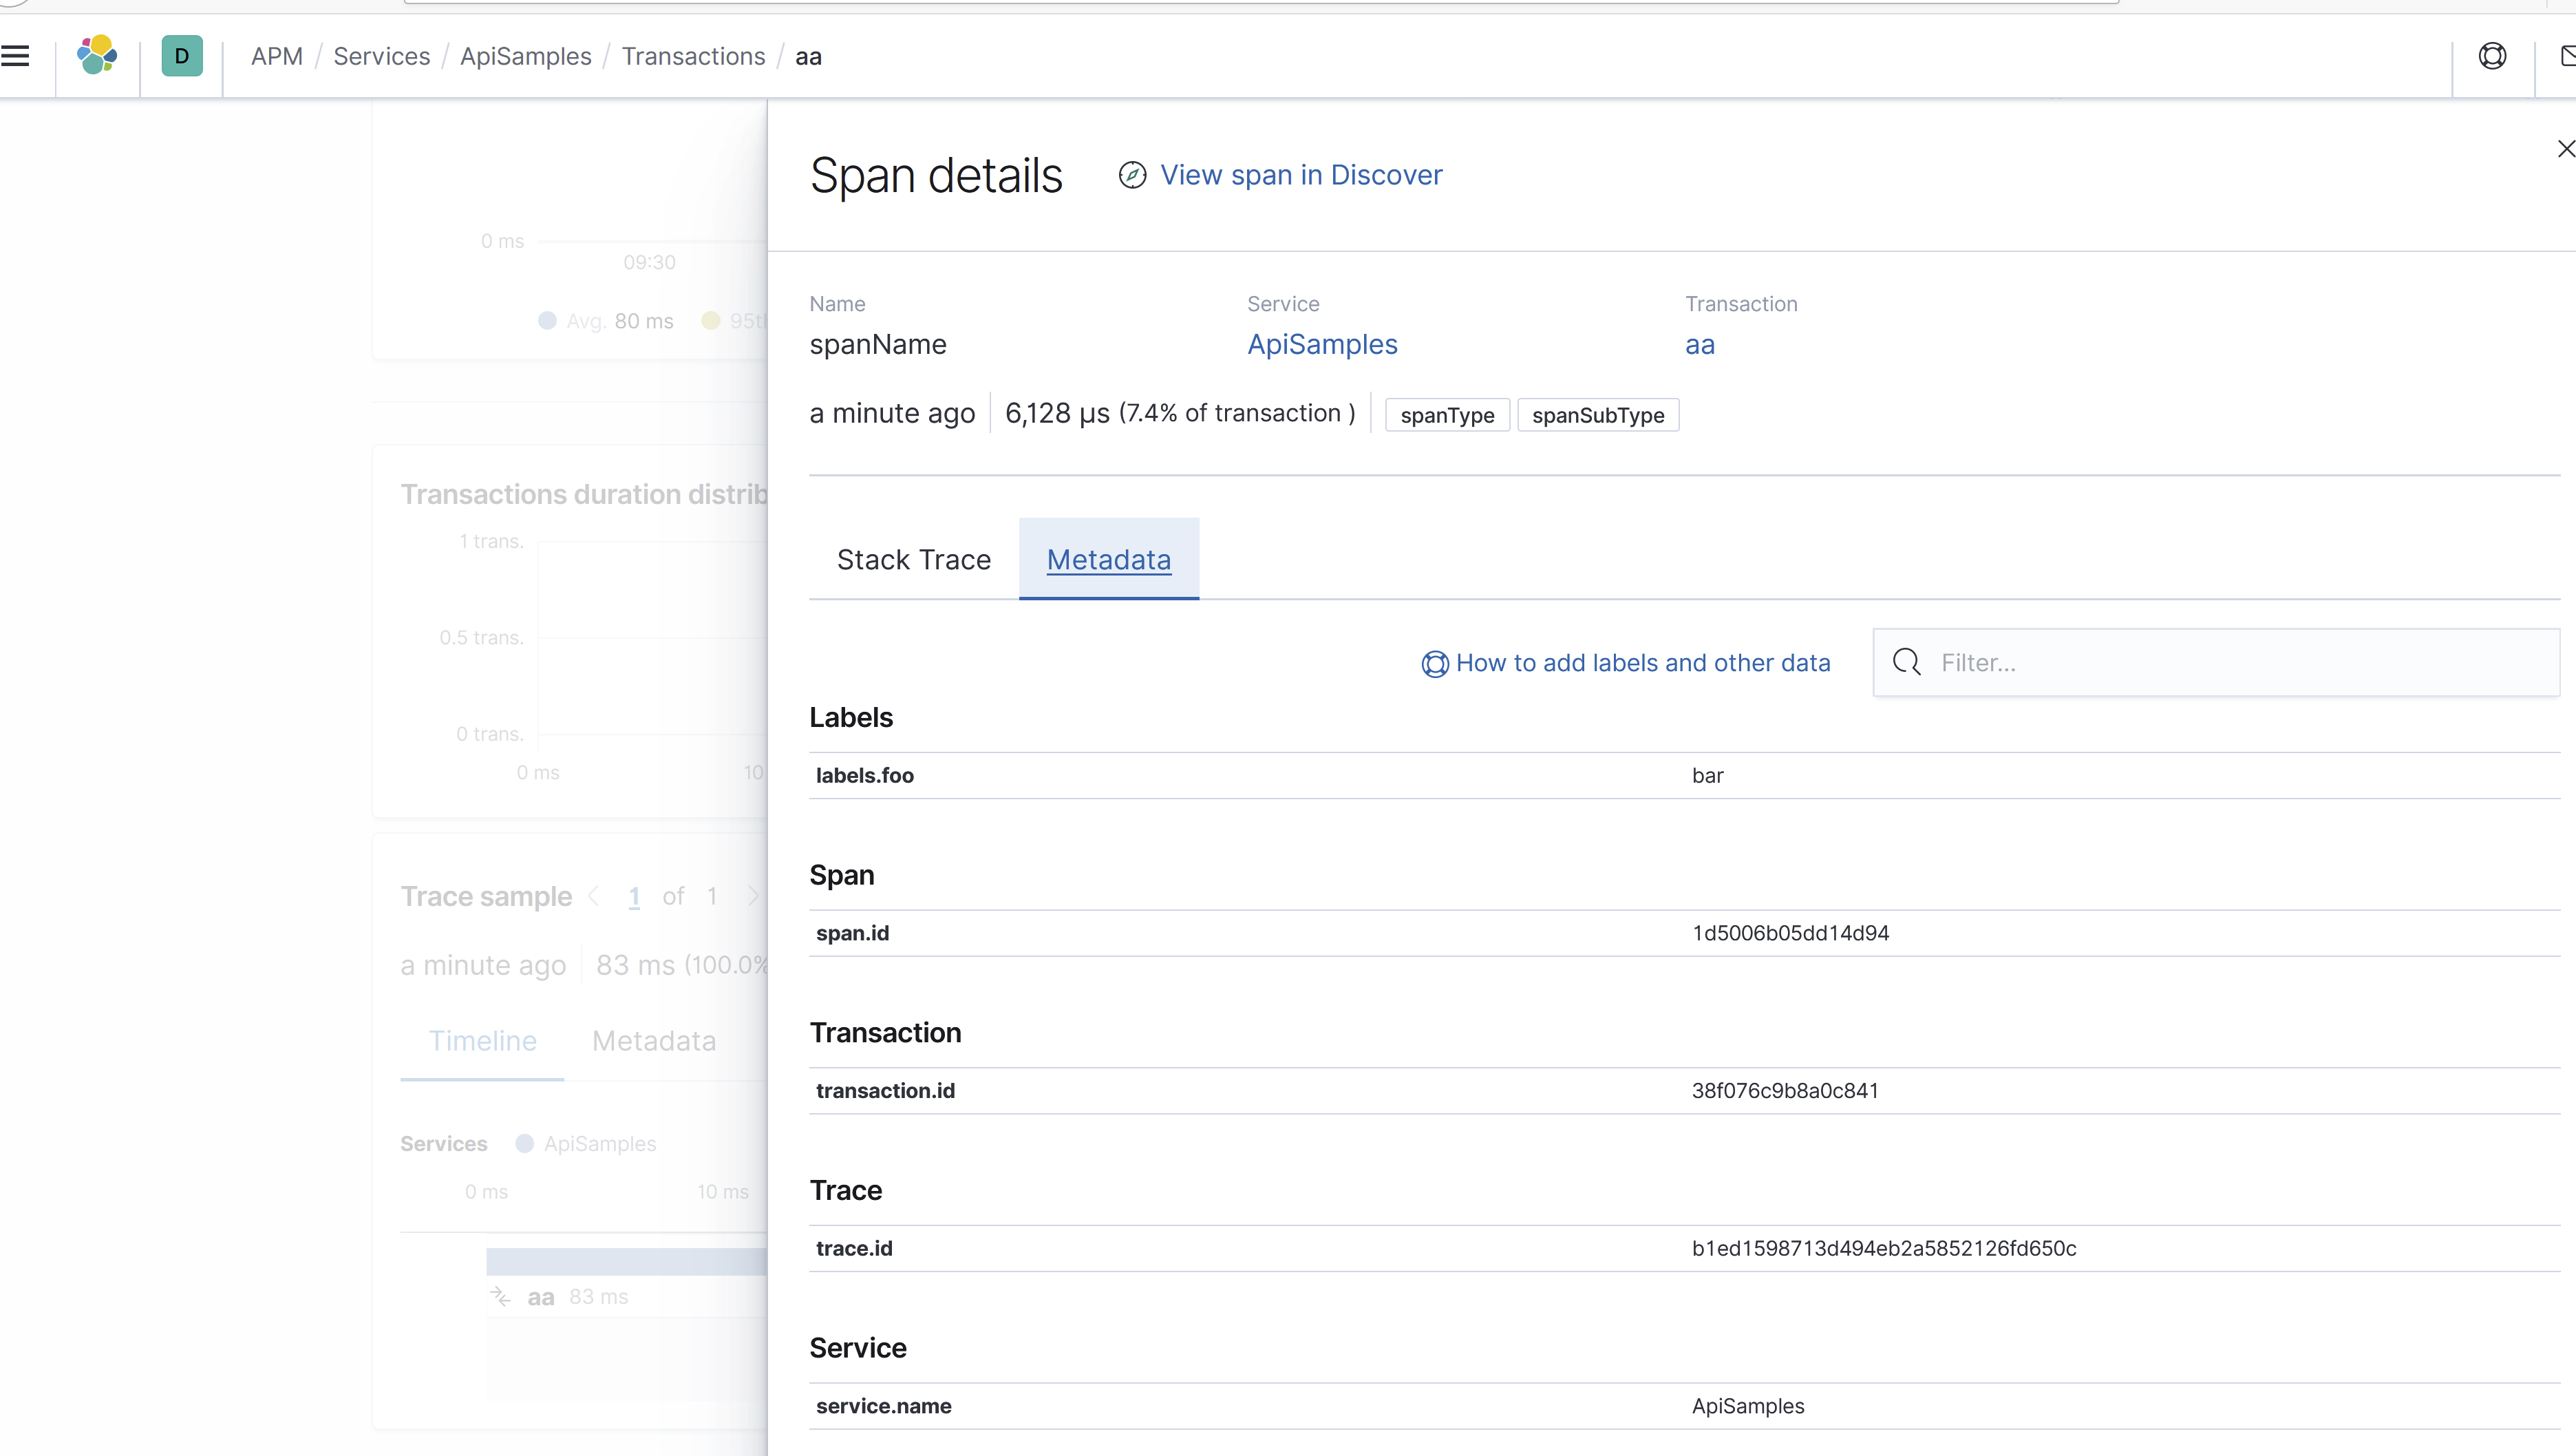
Here is the corresponding span with the label:
Can you maybe give us agent logs on trace level? Any additional info - like what type of app it is, is the transaction that should contain span there (so only the span is missing)?
 gregkalapos
on 13 Oct 2020
gregkalapos
on 13 Oct 2020
Thank you. I'll get that info. I'll also extract the problem into a standalone app.
Thanks again,
Steve
SteveDunn
on 14 Oct 2020
Here's what I see with tracing turned on:
     {PayloadSenderV2} Enqueued Span. newEventQueueCount: 2. MaxQueueEventCount: 1000. Span: Span{Id: 27c75caf252cee59, TransactionId: 3e33fc2f195eb74e, ParentId: 3e33fc2f195eb74e, TraceId: 82b05508816d6a49ab72d2f688f74ff9, Name: Steve's Span, Type: background, IsSampled: True}.
dbug: Elastic.Apm[0]
      {PayloadSenderV2} Sent items to server:
    Transaction{Id: 3e33fc2f195eb74e, TraceId: 82b05508816d6a49ab72d2f688f74ff9, ParentId: null, Name: Steve's Transaction, Type: background, IsSampled: True},
          Span{Id: 27c75caf252cee59, TransactionId: 3e33fc2f195eb74e, ParentId: 3e33fc2f195eb74e, TraceId: 82b05508816d6a49ab72d2f688f74ff9, Name: Steve's Span, Type: background, IsSampled: True}
We're using APM version 7.8.0
SteveDunn
on 14 Oct 2020
@SteveDunn thanks for the logs - this exactly the part I wanted to see.
So this means this looks good from the agent's point of view. Sent items to server means there were no errors reported back from the server and the 2 events were successfully sent to the APM Server. So you say you don't see this span in Kibana? Do you have anything in the APM Server logs (maybe search with the span id - you can also turn on more detailed logs on the APM Server)? Also, what about Steve's Transaction? Is at least that one visible?
Sorry about the lots of questions, but based on the agent log this should work, so we need to look further.
gregkalapos
on 14 Oct 2020
@gregkalapos - yes, I can see the Transaction. When I search for span.id I see nothing in Kibana. When I search via the TraceId I see just the Transaction.
I've asked to see if we can inspect our APM server logs.
Many thanks,
Steve
SteveDunn
on 14 Oct 2020
I have experienced the same issue when adding Labels to a transaction - the transaction does not appear to end up in Elastic .. the spans that were associated with that transaction (which I had not put any Labels into) do end up in Elastic.
Strangely, when I first experimented with APM transactions with labels were getting into Elastic. I am not very familiar with the APMServer (someone else in my company installed and maintains it) .. not sure which version its at .. but am wondering if it is due to a mismatch between the APMServer and this agent.
Question .. I had not noticed the LogLevel configuration parameter! Where does this logging end up (ie is it in a file)?
 pbalwall
on 14 Oct 2020
pbalwall
on 14 Oct 2020
@pbalwall - thanks for your input, it's reassuring to know that I'm not on my own!
re. where logging ends up - I think it uses wherever you've set your ILogger (defaulting to stdout)
SteveDunn
on 15 Oct 2020
@pbalwall said
I am not very familiar with the APMServer (someone else in my company installed and maintains it) .. not sure which version its at .. but am wondering if it is due to a mismatch between the APMServer and this agent.
@gregkalapos we're using:

Would you happen to know if there's any incompatibilities between those packages and version 7.8.0 of APM?
SteveDunn
on 15 Oct 2020
Thanks @SteveDunn .. mine is a .Net Framework environment, using asp.net mvc, and am using Elastic.Apm.AspNetFullFramework v1.6.1
@gregkalapos .. since hopefully I have your attention :-), and speaking about asp.net .. could you please take a look at https://github.com/elastic/apm-agent-dotnet/issues/972, which I put in several days ago and have had no response? I think I have found a issue far more important than even this one :-) .. where the APM agent presumes that the use of thread-local-storage is appropriate for all processing of an http request, But, at least in my testing and my environment, this is not true - very occasionally (and this depends on the size of the incoming request and probably many other factors) the processing of the module (where a ITransaction is put into TLS) occurs in a different managed thread than subsequent processing of the same request.
pbalwall
on 15 Oct 2020
@SteveDunn
APM Server 7.8.0 should be ok with that agent version - we test with that one. Server logs would be super useful here. Another thing that comes to my mind: is there anything special in the values that you send in labels? (e.g. we replace . with _, I'm thinking if it's something similar...)
@pbalwall here is a doc on how logging can be seen on Full Framework. Regarding #972 - I'll also take that one, thanks for all the analysis. Yeah, this threading issue already happened with WCF - luckily we have the infrastructure to replace thread local with current http context, probably that'll be a good approach - but let's take it to #972.
gregkalapos
on 15 Oct 2020
I also played with potential different edge cases, but all seems working, I'm still unable to reproduce this.
If someone could give me a reproducer and/or server logs at trace level when this happens it'd help a lot.
gregkalapos
on 15 Oct 2020
@gregkalapos - we're digging in further and have been looking at the traces on the server. The server is expecting the values of labels to be:
      "dynamic_templates": [
        {
          "labels": {
            "path_match": "labels.*",
            "mapping": {
              "scaling_factor": 1000000,
              "type": "scaled_float"
            }
          }
        },
This results in errors such as:
{"type":"mapper_parsing_exception","reason":"failed to parse field [labels.foo] of type [scaled_float] in document with id 'zLE1K3UBgR4LcndLaUqo'. Preview of field's value: 'bar'","caused_by":{"type":"number_format_exception","reason":"For input string: \"bar\""}}
Our template and version is 7.2.0
I said it was 7.8.0 yesterday, but that's the version of Kibana that I got from clicking the Help button on the web page.
Is 7.2.0 incompatible with labels (or using a now deprecated format for them)?
SteveDunn
on 15 Oct 2020
Armed with our newly found keywords from scouring the server's logs, we found this:
https://discuss.elastic.co/t/failed-to-parse-field-labels-name-of-type-scaled-float/197139
SteveDunn
on 15 Oct 2020
@gregkalapos - we discovered in our logs that there were pre-existing labels and all have number fields.
Our template for 7.2.0 has all types in there, which looks like it means that the first bit of data ingested in to the index snags the type. Are were misunderstanding something about elastic supports multiple types for a field?
SteveDunn
on 16 Oct 2020
@SteveDunn, the discuss entry you linked is very likely the same problem as yours. To me that thread explains the problem.
There should be mappings with all 3 data types as said here for labels. And here is how you can fix it. Have you tried that?
The other thing that happens here is that data type mismatch happens after the APM Server receives the event - the ingestion to Elasticsearch happens async - so the APM Agent sends the data to APM Server, then a basic validation happens but after that the APM Server returns with an HTTP status code and the ingestion only happens after that async. That's why the APM Server returned 202 and that's why we don't see this problem in the agent logs.
So far I think the only way to fix this will be to fix the template to contain all 3 types.
gregkalapos
on 16 Oct 2020
To shed a bit of light on this... I work with @SteveDunn.
I think I _may_ know what's going on but I'm not entirely sure how it's come about.
We have multiple index templates for apm within elastic, only two of which are setting mappings. To allow others to follow I'll use screenshots as opposed to json.
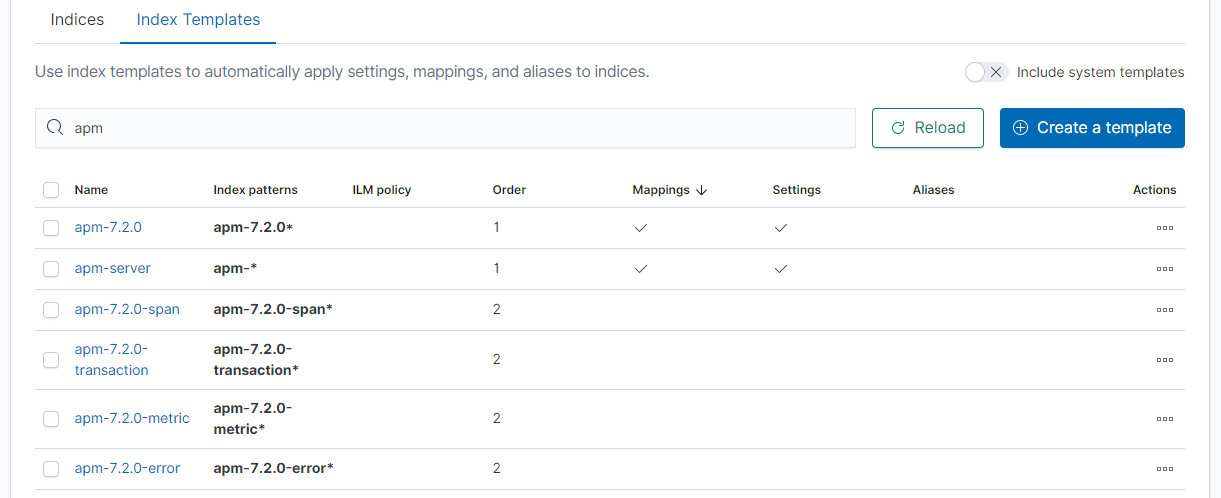
The index that the events are being saved to is apm-7.2.0-span so there's two possible templates it could have used when it was created.
Here are the two index configurations (Naturally different)
apm-server : https://gist.github.com/fenneh/9d503554b919a44fba67023070d05a87#file-apm-server-json
apm-7.2.0 : https://gist.github.com/fenneh/9d503554b919a44fba67023070d05a87#file-apm-7-2-0-json
I'm assuming this is falling apart due to the omission of
          "labels": {
            "type": "object"
Within apm-server - I'm not sure how elastic would chose what template to use if they both have the same order.
If I had to hazard a guess at what's happened, the template apm-server is from an older version of apm server, an upgrade of apm server has happened and the template names have been changed.
I think the resolution for us would be to drop the apm-server template and force a new index to be created by altering the output index names on APM server itself (To allow the index to pick up the _correct_ template).
 fenneh
on 16 Oct 2020
fenneh
on 16 Oct 2020
@fenneh thanks for the update - sounds good.
I can't give you any explanation on how it's come about, but your explanation sounds reasonable.
Let me know if you managed to fix the issue.
From the agent's point of view I'd say there is nothing to do, but if you need help we can transfer the issue to the APM Server team.
gregkalapos
on 19 Oct 2020
Can we close this?
gregkalapos
on 20 Oct 2020
I think so @gregkalapos . Thank you very much for your help. We'll be in touch if there are any related issues that we discover.
Regards,
Steve
SteveDunn
on 20 Oct 2020
Related issues
 graphaelli
·
8Comments
graphaelli
·
8Comments
 iqmeta
·
3Comments
iqmeta
·
3Comments
 SergeyKleyman
·
8Comments
SergeyKleyman
·
8Comments
 kszymanski
·
7Comments
gregkalapos
·
4Comments
kszymanski
·
7Comments
gregkalapos
·
4Comments