Apm-agent-dotnet: Agent does not work on new Asp.Net Core 3.1 Project
Describe the bug
Agent does not work on new Asp.Net Core 3.1 Project. Browser loads the page forever.
To Reproduce
Steps to reproduce the behavior:
- Create a new Asp.Net Core 3.1 MVC Project
- Run and see the homepage
- Stop debugging
- Add nuget package : Install-Package Elastic.Apm.AspNetCore -Version 1.5.1
- Add configuration to the appsettings.json file :
 "ElasticApm": {
    "SecretToken": "",
    "ServerUrls": "http://localhost:8200", //Set custom APM Server URL (default: http://localhost:8200)
    "ServiceName": "TestApp" //allowed characters: a-z, A-Z, 0-9, -, _, and space. Default is the entry assembly of the application
  }
- Add directive to the startup.cs file:
 public void Configure(IApplicationBuilder app, IWebHostEnvironment env)
        {
            app.UseElasticApm(Configuration);
            if (env.IsDevelopment())
            {
                app.UseDeveloperExceptionPage();
            }
            else
            {
                app.UseExceptionHandler("/Home/Error");
                // The default HSTS value is 30 days. You may want to change this for production scenarios, see https://aka.ms/aspnetcore-hsts.
                app.UseHsts();
            }
- Press run (debug) button
Expected behavior
Page to be loaded.
But browser tries to load the page forever. No exception. No content.


 alierdogan70
All 15 comments
@alierdogan70 thanks for reporting this.
I'm unable to reproduce this - I created a plain new 3.1 ASP.NET Core MVC project, all worked as expected.
Could you maybe do me a favor? I looked at the logs you attached - those are somewhat useful, but it'd be better with more agent logs. Here is an example on hot to change the log level - could you please set it to Trace and attach new logs? If all works good you'll see way more logs from Elastic.Apm - that would tell me how far the agent captures things in your process. Another useful thing would be a callstack captured when this happens - but already the logs would be big help here.
Thanks.
 gregkalapos
on 25 Jun 2020
gregkalapos
on 25 Jun 2020
Hi @gregkalapos ,
Thank you for the reply. Debugger cannot pass this line :
app.UseElasticApm(Configuration);
So I could not attach call stack
Cheers
alierdogan70
on 25 Jun 2020
Thanks @alierdogan70,
strange, the agent doesn't even seem to capture the incoming request itself. Nothing seen from that part.
Is this maybe IIS in-process hosting?
Also, you say, this already happens with a simple template project (lik a plain default ASP.NET Core MVC project). If so, would it be possible to give me the app that causes this? That way I could debug this easier.
Thanks for your help so far! Very much appreciated.
gregkalapos
on 25 Jun 2020

Running self hosted has fixed the issue. In our scenario since we use Windows Authentication we have to use IIS unfortunately.
alierdogan70
on 25 Jun 2020
Running self hosted has fixed the issue. In our scenario since we use Windows Authentication we have to use IIS unfortunately.
Perfect, then that must be the key point 👍. I'll follow up here.
gregkalapos
on 25 Jun 2020
@alierdogan70 I spent the last hours trying to reproduce this, but so far I was not able to see this problem myself.
Here is the setup I tried:
- IIS on Windows 10
- ASP.NET Core 3.1
- I copied your configs into
appsettings.json. - Configured the app to use Windows authentication and disabled all other authentication mode
- Tried both in-process and out-of-process hosting
Everything worked and user capturing also works, so the agent also captured the user that was authenticated through Windows authentication.
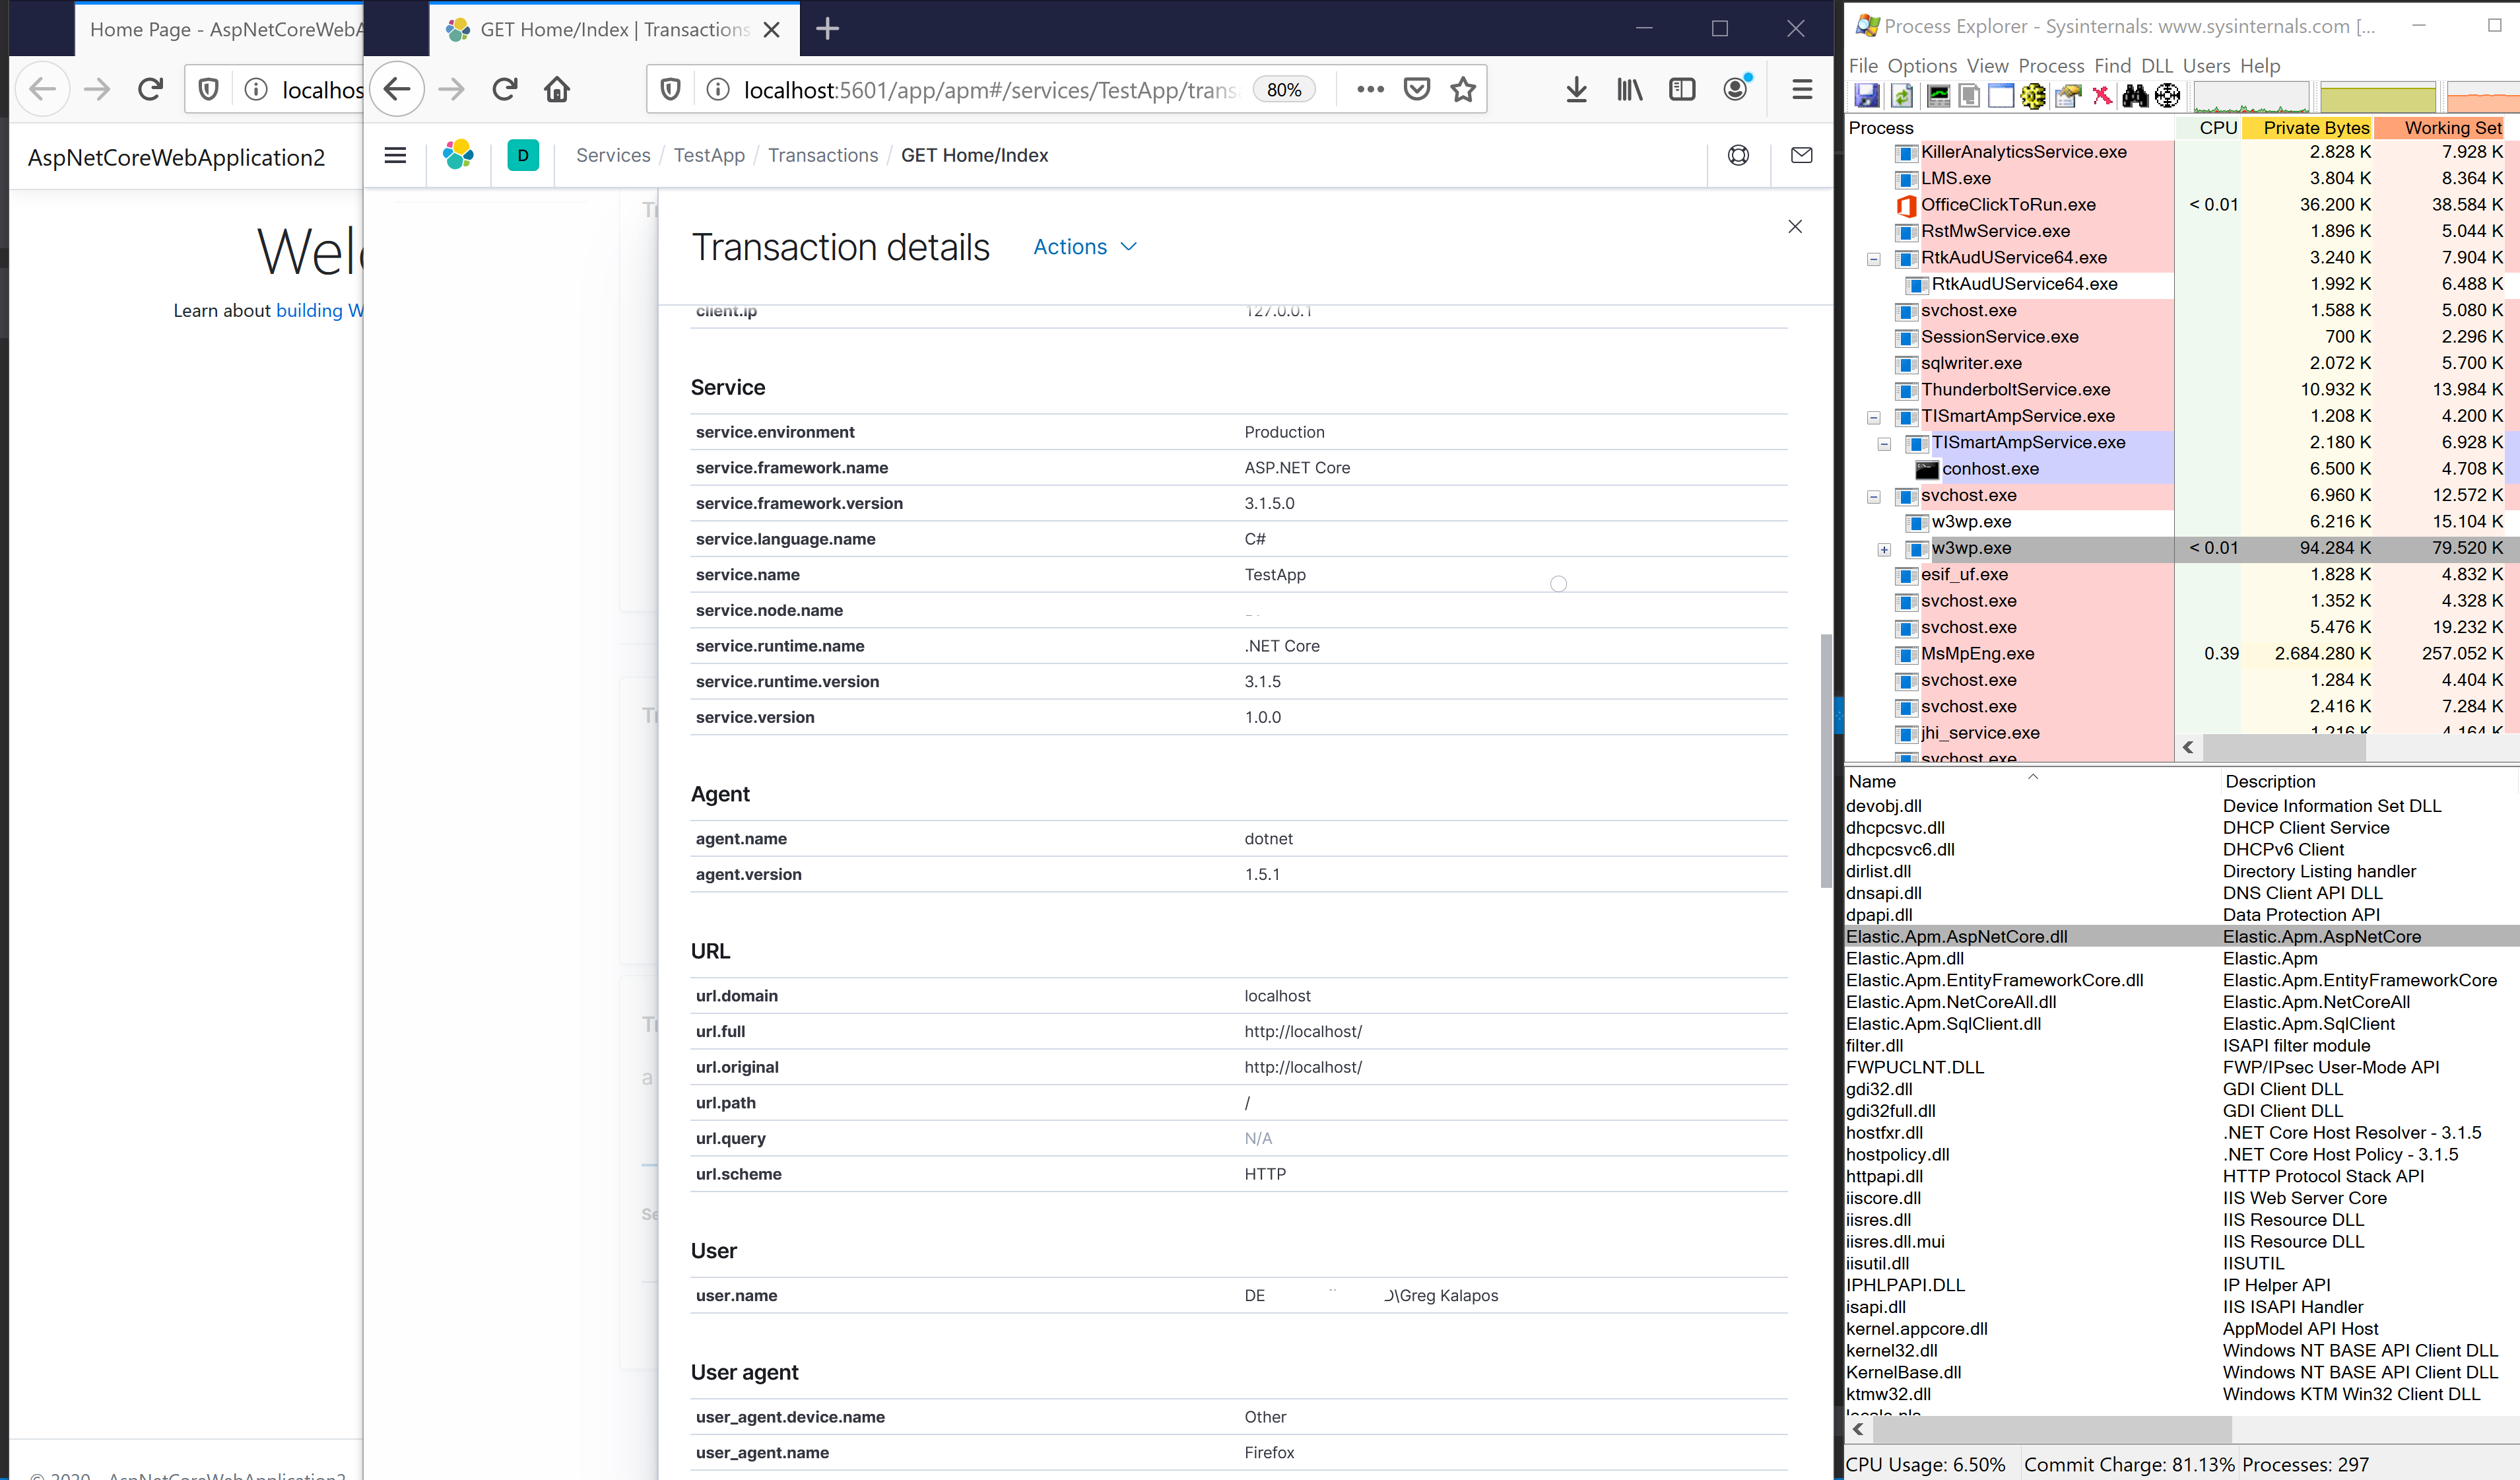
Also, in my last comment I was a bit optimistic that simply IIS in-process would reproduce this: in-process hosting is the default in 3.1, so if that'd be the problem then we'd already have lots of users reporting this (but so far I think this is the only 1 report from @alierdogan70 so far); so after looking into this more, I think this must be a less common setup.
Unfortunately I'm out of ideas. Any other hint you could give me to reproduce this? Or maybe a complete reproducer?
gregkalapos
on 9 Jul 2020
I have exactly the same issue while debugging in VS. With Kestrel everything is running fine. But with IIS Express, the browser just keeps loading.
 barthermans
on 13 Jul 2020
barthermans
on 13 Jul 2020
Thanks for the info @barthermans. Could you or anyone else show me all callstacks from the application when this happens?
E.g. in Visual Studio in "Diagnostic Tools" under "CPU Usage" when you push the "Break All" I think you'll see the threads and also where the application hangs. _Of course you can use any other tool..._
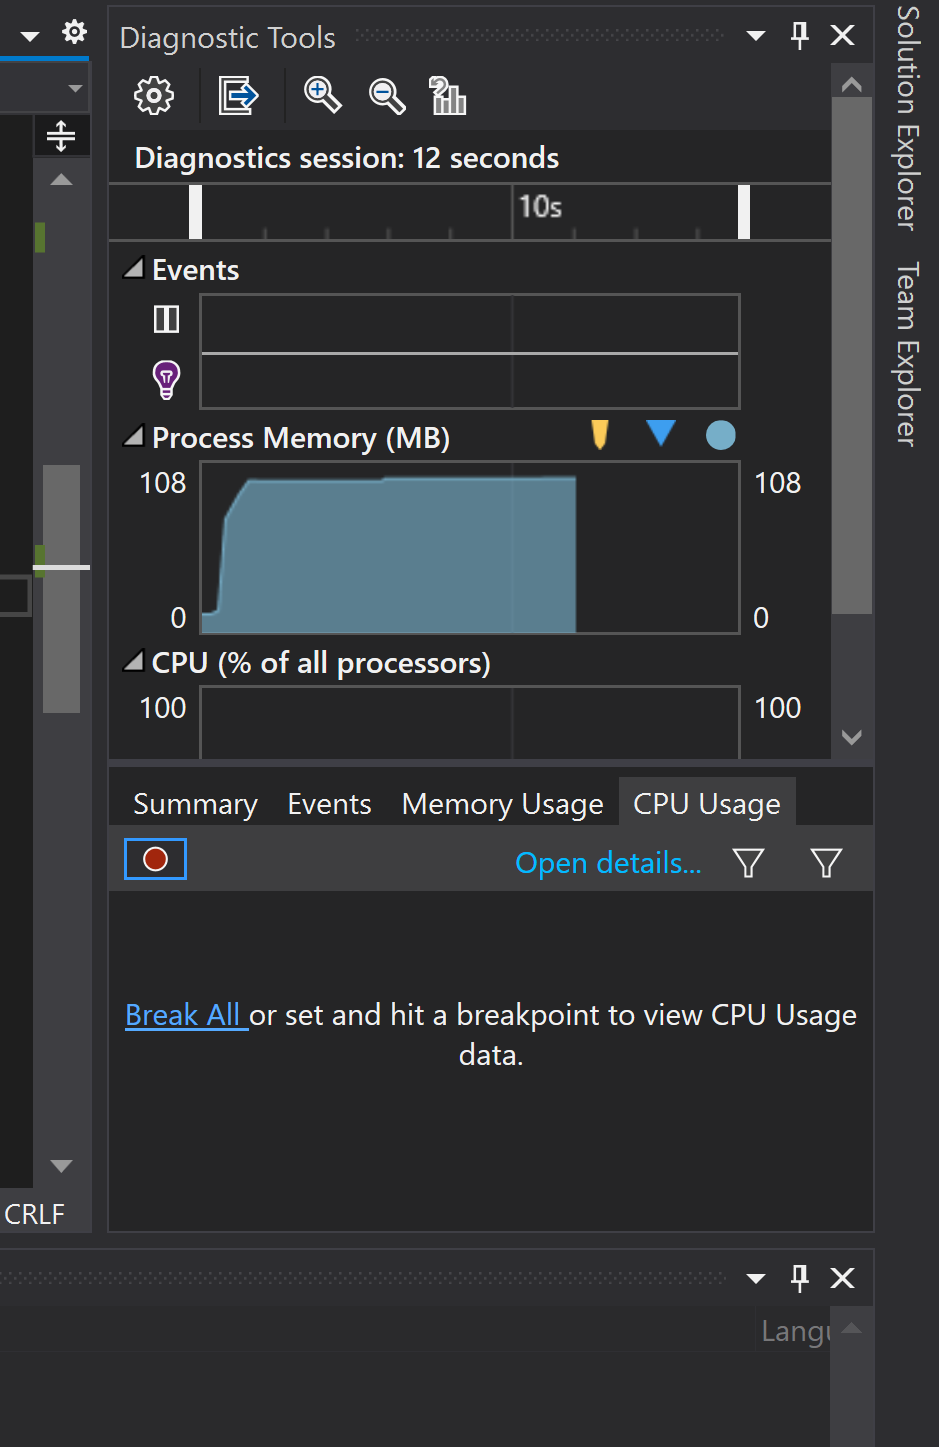
I really would like to fix this issue, but I need more info here, neither the APMTest.Web.zip attached by @alierdogan70 nor my own experimentation reproduces this and the info that the browser keeps loading is unfortunately not enough for me to know where to look. So I'd appreciate any comment with more technical details, like:
- Showing all callstacks from the app when this happens
- If there is any non default setting, then the details of those
- Any observations across different IIS/IIS Express or .NET Core versions
- Or in general anything more than "app keeps loading"
Thanks.
gregkalapos
on 13 Jul 2020
Oh, and maybe another idea: could you please also try the latest version which we released end of last week (Version 1.6.0) - there is 1 fix in it around platform detection that caused issues during startup. It'd be worth a try to see if that fixes this issue.
gregkalapos
on 13 Jul 2020
I've already updated to 1.6.0, but the issue remains.
I completely understand that 'keeps loading' isn't very useful, but I'm not sure where to look tbh.
I've only tested this with an existing application, I will try again later today with a new one.
In the meantime, here is some of the extra info you requested. Hope it helps.
appsettings.json:

Diagnostic Tools, after pressing Break All:

Breaks on:

Details Caller/Callee:

Details Call Tree:

Details Modules:

Details Functions:

Let me know if you need more.
barthermans
on 13 Jul 2020
Thanks @barthermans, I really appreciate it!
With the unresolved symbols I still can't see much - but at least we know 1.6.0 does not solve it.
My next candidate that could cause the problem would be metrics collection. Could you set MetricsIntervalInMilliseconds to 0? With that we'd disable metrics collection. Like this in appsettings.json:
"ElasticApm": {
    "MetricsInterval": 0,
    //...rest of the configs
  }
@gregkalapos interesting, now it seems to be working. So it's Metrics related.
barthermans
on 13 Jul 2020
Great! Then at least we know what the problem is.
I think this is a related issue: https://github.com/elastic/apm-agent-dotnet/issues/682
In short: It'd be a problem with reading performance counters.
Could you maybe do one last thing? Can you enable all configs again (just remove the MetricsInterval part) and add this new config:
```
"ElasticApm": {
"DisableMetrics": "system.cpu.total.norm.pct"
//...rest of the configs
}
````
With that you'll disable system CPU collections (system wide CPU usage) - that's the only metric we collect with PerfCounters on Windows. If it still works, then it's indeed a PerfCounter related issue - if not I'll look further. In case it works, I'd also suggest this config as an immediate workaround, you'll have everything including every other metric, except system CPU.
PerfCounter is a huge pain on Windows and there is already an issue to get rid of it: https://github.com/elastic/apm-agent-dotnet/issues/715
gregkalapos
on 13 Jul 2020
@gregkalapos still works with cpu PerfCounter disabled. I'll keep an eye on #715 ;)
@alierdogan70 maybe you can give it a try and see if this works for you?
barthermans
on 13 Jul 2020
It sounds like there is some resolution to the reported issue. I'm going to close this one out for now due to inactivity; if there's more information that can help in diagnosing the problem if it still exists in a newest agent version, please feel free to reopen with additional detail.
 russcam
on 4 Nov 2021
russcam
on 4 Nov 2021
Related issues
 vhatsura
·
4Comments
vhatsura
·
4Comments
 bliles
·
7Comments
bliles
·
7Comments
 gardnerr
·
7Comments
gardnerr
·
7Comments
 fredeil
·
3Comments
fredeil
·
3Comments
 kszymanski
·
7Comments
kszymanski
·
7Comments