Apm-agent-dotnet: Experiencing a Memory Leak
Describe the bug
Several, but not all, tested .NET Framework services have what appears to be a memory leak.
To Reproduce
Steps to reproduce the behavior:
- Grab existing .NET Framework WebAPI service.
- Install nuget package Elastic.Apm.AspNetFullFramework 1.3.0
- Add to the web config modules section:
<add name="ElasticApmModule" type="Elastic.Apm.AspNetFullFramework.ElasticApmModule, Elastic.Apm.AspNetFullFramework" /> - Add to the web config app settings section:
<add key="ElasticApm:ServerUrls" value="http://apmhost:8200" /> <add key="ElasticApm:ServiceName" value="ServiceName" /> <add key="ElasticApm:ServiceVersion" value="2020.02.25.01" /> <add key="ElasticApm:Environment" value="Production" /> <add key="ElasticApm:TransactionSampleRate" value="0.25" /> - On controllers methods that have parameters in the path, on first line of body, update transaction name to have the parameters replaced to hard-coded text to cause grouping to work better.
- Deploy service to IIS 10 server 2016
- Send 10 - 20 requests per minute to service
Expected behavior
Memory usage to be unchanged or bumped a bit higher, not unstopped growth of usage.
I have tried to recreate this issue in our dev environment and have even tried using 1000s of requests a minute to speed things up but have not been able to recreate. We are experiencing this on 2 of the 3 .net framework services we have in production. 2 .net core services in production don't seem to be having the issue. We have since pulled back 1 of the 2 from production and just today tried the 2nd one in production to confirm the results.
The one deployed today only had the steps above as the single changeset.
No lag in traffic to the APM server is observed. All transactions seem to be flowing to the APM server quickly and hit rates or transactions showing up there are as expected. So nothing is jumping out at me like stuff is getting clogged. I thought of #387, but wouldn't that only be applicable if events were clogged?
As of typing this issue out, the remaining prod service has a memory footprint of over 2gb.
IIS Worker Pool Snapshot:

The row highlighted represents the service we deployed today. The yellow highlight a few rows below represents the other .net framework service that has been out there for about a week now with no issues. The service does not share its app pool. Resetting the service or app pool immediately corrects / resets the memory issue.
Kibana server memory usage:

The line drawn is when we promoted the problem service to production.
We first encountered this issue last Friday and rolled-back the service to investigate. We were tipped off by high memory usage on the server, CPU spiking, and timeouts occurring for clients trying to talk to that service. Logs in APM from that service at that time had some spans showing 36 seconds and higher even though other external data sources indicated the duration of those spans should have been much lower (under a second). Rolling back resolved the issue.
I'll continue trying stuff out in our dev environment to try to recreate it there.
Please advise
 sluebbert
All 9 comments
It is interesting that even commenting out the module in the web.config <add name="ElasticApmModule" type="Elastic.Apm.AspNetFullFramework.ElasticApmModule, Elastic.Apm.AspNetFullFramework" /> still results in a memory leak.
As expected, no transactions or metrics get sent to the apm server when this happens.
I'm guessing the existence of the apm agent and diagnostic dlls loaded in memory (due to us asking for current transactions in code) is continuing to cause this? Is that even possible? Is there static initialization happening for example?
I'll keep poking around.
sluebbert
on 27 Feb 2020
We have a few other working services now to compare with. Services that are not hogging up memory are those that just enable the apm agent and that's it.
Each service that grabs up a ton of memory over time are those that access the public transaction or span api.
For example:
var tran = Agent.Tracer.CurrentTransaction;
if (tran != null)
    tran.Name = tran.Name.Replace(accountNumber, "{accountNumber}");
That code is called even if the module is removed from the web.config, so I wonder if that narrows it down.
sluebbert
on 27 Feb 2020
Thanks for all the info @sluebbert.
That code is called even if the module is removed from the web.config, so I wonder if that narrows it down.
Yes, it narrows it down, at least it gives me some ideas. That code gets called and that means the agent is indeed initialized - for example it's going to collect metrics plus of course all the transactions and spans you capture manually.
I'll dig deeper into this.
 gregkalapos
on 28 Feb 2020
gregkalapos
on 28 Feb 2020
Thanks for checking it out.
I seemed to have recreated it from creating a new .net framework webapi service within this repo's source code. I just:
- added in a new service, added references to the required projects
- did not add the module reference to the web config
- added the above code snippet to the ValuesController.Get()
- sent 10 requests a second for several hours to the controller. -I'm not sure rate of requests impacts anything.
After a couple hours the private bytes reported by Visual Studio's diagnostic tools shows 230mb in use. I think I remember that starting at about ~110mb. I can't see that far back and don't want to start over yet on the test.
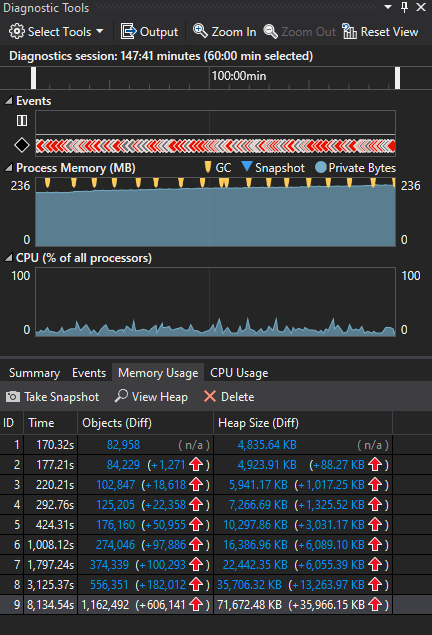
I'll leave it running for now to see if it keeps growing. I'm not experienced with these tools and rarely watch memory usage this closely so I don't know how much growth is normal in debug mode.
[EDIT]
As of now private bytes is up to 356mb almost 8 hours in.
sluebbert
on 28 Feb 2020
Hi @sluebbert,
I'm quite sure this is related to GC metrics collection.
Workaround
e.g.: set ELASTIC_APM_DISABLE_METRICS=clr.gc.*
For now, I'd say the easiest would be to just disable GC metrics collection for the windows .NET Framework apps where this happen. For doing this you can use the DisableMetrics setting. Easiest is to just set the ELASTIC_APM_DISABLE_METRICS environment variable. Here is the list of all metrics - if you disable everything that is related to GC (that's what matches clr.gc.*) then the agent won't start the ETW session. After some testing that seems to fix the problem.
Side-effect of the workaround
With this you won't have GC metrics. For GC metrics we don't have a built-in chart yet, so unless you created a chart for GC metrics yourself, you should not see any difference - except of course not having the memory leak - that should go away.
Some more details
This also explains why you only see this on Full Framework and not on .NET Core - on Full Framework we use ETW, on .NET Core we collect GC metrics with EventSource.
I'll work on a fix - that'll be of course the long term fix for this issue.
Sorry about the trouble caused by this.
gregkalapos
on 4 Mar 2020
@gregkalapos,
Thanks for the quick responses. I added that setting to the web config for one of our impacted services and it seems to have done the trick. I haven't seen any abnormal growth for several hours now.
I'll keep an eye on it over the next few days to verify.
sluebbert
on 4 Mar 2020
750 with the fix is already on master - I'll keep this open for the next days to make sure all good - if so, then I'll close and the fix will be in the next release.
gregkalapos
on 5 Mar 2020
A few days later and still no issues with memory.
sluebbert
on 6 Mar 2020
Hi @sluebbert,
a new agent version (version 1.4.0) just went out and it contains the fix for this issue. With that you could remove the ELASTIC_APM_DISABLE_METRICS setting, and with the default configs everything should be fine.
If you have some time, could you maybe verify that this is indeed the case with your app?
I'm closing this now - feel free to just respond here. If something is not ok, we can reopen this issue anytime.
gregkalapos
on 20 Mar 2020
Related issues
 gardnerr
·
7Comments
gardnerr
·
7Comments
 vhatsura
·
4Comments
vhatsura
·
4Comments
 mterwoord
·
7Comments
gregkalapos
·
5Comments
mterwoord
·
7Comments
gregkalapos
·
5Comments
 NicolasREY69330
·
4Comments
NicolasREY69330
·
4Comments