Apexcharts.js: Exec ZoomX not triggering in line chart.
Bug report
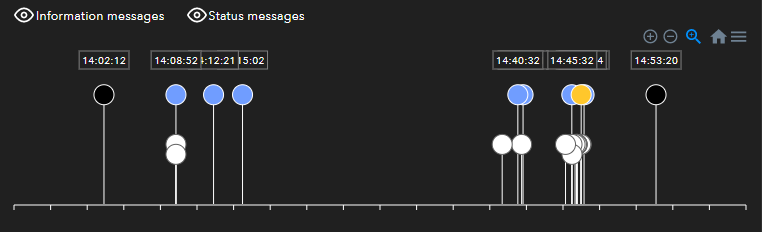
I am not able to zoom in X axis programatically using zoomX on a line chart. I have simulated a "Lollipop Chart" using a line chart and I am trying to use zoomX on an onClick event from a button. The function does not zoom or send an error message.
Codepen
https://codesandbox.io/s/zoom-lollipop-chart-8rwj4?file=/src/App.js
Explanation
Code line I am using:
ApexCharts.exec('charID', 'zoomX', new Date('2020-04-03T11:00:00').getTime(), new Date('2020-04-04T12:00:00').getTime());
Example Chart Image:
Options Configuration:
IMPORTANT NOTES:
- The series values are timestamps and each lollipop color is one series.
- Each lollipop stick + label is an annotation on that specific timestamp.
- Each lollipop is clickable using "dataPointSelection".
chart: {
id: 'flight_lolipop',
        group: undefined,
        type: 'area',
        background: '#202020',
        fontFamily: 'Avenir Next',
        height: '100%',
        width: '100%',
        toolbar: {
            show: true,
            offsetX: 0,
            offsetY: 0,
            tools: {
                download: true,
                selection: true,
                zoom: true,
                zoomin: true,
                zoomout: true,
                pan: false,
                reset: true
            },
        },
        zoom: {
            enabled: true,
            type: 'x',
            autoScaleYaxis: false,
            zoomedArea: {
              fill: {
                color: '#90CAF9',
                opacity: 0.4
              },
              stroke: {
                color: '#0D47A1',
                opacity: 0.4,
                width: 1
              }
            }
        },
        events: {
            dataPointSelection: function(event, chartContext, config) {
                const seriesIndex = config.seriesIndex;
                const dataPointIndex = config.dataPointIndex;
                const seriesName = config.w.globals.seriesNames[seriesIndex];
                const faultTimestamp = config.w.globals.seriesX[seriesIndex][dataPointIndex];
                const faultCode = config.w.globals.seriesZ[seriesIndex][dataPointIndex];
                lolipopClickEvent(seriesName, moment(new Date(faultTimestamp)).format('YYYY-MM-DDTHH:mm:ss'), faultCode);
            }
        }
      },
      colors: [
        '#000000',
        '#FF5050',
        '#FFC72C',
        '#709DFF',
        '#808080',
        '#FFFFFF',
      ],
      dataLabels: {
        enabled: false,
        enabledOnSeries: [0, 1, 2, 3],
        offsetX: 0,
        offsetY: -15,
        style: {
            fontSize: '10px',
            fontFamily: 'Avenir Next',
            fontWeight: 500,
            colors: ['#202020']
        },
        formatter: function (val, opt) {
            return moment(new Date(opt.w.globals.labels[opt.dataPointIndex])).format('HH:mm:ss');
        },
        background: {
            enabled: true,
            foreColor: '#FFFFFF'
        }
      },
      stroke: {
        show: true,
        curve: 'stepline',
        lineCap: 'butt',
        colors: undefined,
        width: 0,
        dashArray: 0,
      },
      grid: {
          show: false,
          xaxis: {
            lines: {
                show: false,
            },
          },
          yaxis: {
            lines: {
                show: false,
            },
          },
      },
      markers: {
        size: 10,
        strokeColors: [
            '#FFFFFF',
            '#FFFFFF',
            '#FFFFFF',
            '#FFFFFF',
            '#FFFFFF',
            '#606060',
        ],
        strokeWidth: 1,
        strokeOpacity: 0,
        strokeDashArray: 0,
        fillOpacity: 1,
        discrete: [],
        shape: "circle",
        radius: 0,
        offsetX: 0,
        offsetY: 0,
        onDblClick: undefined,
        showNullDataPoints: false,
        hover: {
            size: 12,
            sizeOffset: 2
        }
      },
      fill: {
        type: 'solid',
        gradient: {
          shadeIntensity: .5,
          inverseColors: false,
          opacityFrom: 1,
          opacityTo: 1,
          stops: [0, 90, 100],
        },
      },
      yaxis: {
          show: false,
          tickAmount: 3,
          min: 0,
          max: 3,
          labels: {
              minWidth: 0,
              style: {
                  colors: 'white',
                  fontSize: '12px',
                  fontFamily: 'Avenir Next',
                  cssClass: 'apexcharts-xaxis-label',
                },
            },
        },
        xaxis: {
            type: 'datetime',
            tickAmount: numberOfTicks,
            min: new Date(xMin).getTime(),
            max: new Date(xMax).getTime(),
            tickPlacement: 'on',
            labels: {
                show: false,
                rotate: 10,
                style: {
                    colors: 'white',
                    fontSize: '12px',
                    fontFamily: 'Avenir Next',
                    cssClass: 'apexcharts-xaxis-label',
                },
                formatter(val, timestamp) {
                    return moment(new Date(timestamp)).format('HH:mm:ss');
                },
            },
            axisBorder: {
                show: true,
                color: '#FFFFFF',
                height: 1,
                width: '100%',
                offsetX: 0,
                offsetY: 0
            },
            axisTicks: {
                show: true,
                borderType: 'solid',
                color: '#FFFFFF',
                height: 5,
                offsetX: 0,
                offsetY: 0,
            },
            tooltip: {
                enabled: false,
                formatter: undefined,
                offsetY: 0,
                style: {
                  fontSize: 0,
                  fontFamily: '',
                },
            }
        },
        legend: {
            show: false,
        },
        noData: {
            text: 'NO DATA AVAILABLE',
            align: 'center',
            verticalAlign: 'middle',
            offsetX: 0,
            offsetY: 0,
            style: {
                color: '#FFFFFF',
                fontSize: '20px',
                fontFamily: 'Avenir Next'
            }
        },
        annotations: {
            position: 'back',
            xaxis: [],
            texts: []
        },
        tooltip: {
            enabled: true,
            enabledOnSeries: undefined,
            shared: false,
            followCursor: false,
            intersect: true,
            inverseOrder: false,
            fillSeriesColor: false,
            theme: 'dark',
            style: {
                fontSize: '12px',
                fontFamily: 'Avenir Next',
            },
            onDatasetHover: {
                highlightDataSeries: false,
            },
            x: {
                show: true,
                format: 'HH:mm:ss',
                formatter(val) {
                    return moment(new Date(val)).format('MMM DD , YYYY HH:mm:ss');
                },
            },
            y: {
                formatter: function(value, { series, seriesIndex, dataPointIndex, w }) {
                    return '';
                },
                title: {
                    formatter: (seriesName) => seriesName,
                }
            },
            z: {
                formatter: undefined,
                title: ''
            },
            marker: {
                show: true
            },
            items: {
                display: 'flex',
            },
            fixed: {
                enabled: false,
                position: 'topLeft',
                offsetX: 10,
                offsetY: 10,
            }
        }
 ChuckzM
>All comments
zoomX method was introduced in 3.18.0
So, please update your apexcharts version to the latest and it will work as expected.
 junedchhipa
on 3 Jul 2020
junedchhipa
on 3 Jul 2020
Related issues
 taheri24
·
19Comments
taheri24
·
19Comments
 sdq-sts
·
15Comments
sdq-sts
·
15Comments
 stalnikar
·
13Comments
stalnikar
·
13Comments
 dougnewnham
·
18Comments
dougnewnham
·
18Comments
 CheyenneForbes
·
17Comments
CheyenneForbes
·
17Comments
Most helpful comment
zoomXmethod was introduced in 3.18.0So, please update your apexcharts version to the latest and it will work as expected.