Apexcharts.js: Wrong point colors when null values are involved
Bug report
Codepen
No Codepen needed, also occurs in the demo at https://apexcharts.com/javascript-chart-demos/line-charts/null-values/
Explanation
Hover over 7 on the x axis. The colors of the points on the yellow and blue lines are swapped.
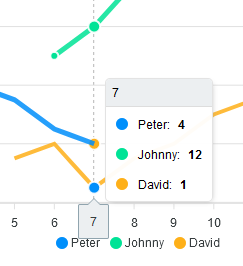
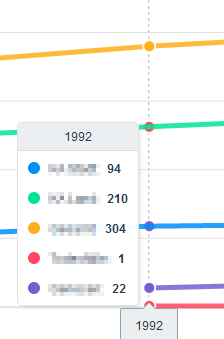
I encountered this on a real project, and the more lines you have the weirder the behaviour of the dot colors. Sometimes, a dot color is showing twice:
 Connum
All 5 comments
The issue vanishes when setting the markers option to a value > 0.
Connum
on 25 Mar 2020
Which version of apexcharts are you using? I cannot reproduce this with the latest version.
 junedchhipa
on 25 Mar 2020
junedchhipa
on 25 Mar 2020
Latest version from npm, but as I said it also occurs in the demo (tested with Firefox latest, Windows).
Connum
on 25 Mar 2020
Ah! I was checking in chrome.
Will test in Firefox.
junedchhipa
on 25 Mar 2020
I'm seeing this behavior in Chrome on Mac
- Chrome version 87.0.4280.88 (Official Build) (x86_64)
- vue-apexcharts v1.6.0
- apexcharts v3.23.0
It's a chart with 4 series, multiple types in use: area, line, area, column. I'd like to set markers.size: 0 to hide the line markers. But that causes the tooltip markers to display the wrong colors on hover. Based on @Connum's comment I tried setting markers.size to .001 - something greater than 0 but still not easily visible. It seems to work.
Sharing here in case it helps someone. Here's my chart setup:
      series: [{
        name: 'Total Members',
        type: 'area',
        data: [100, 100, 105, 105, 98, 98, 98, 100, 100, 100, 99, 99]
      }, {
        name: 'Members with Suggestions/Reconfirmations',
        type: 'line',
        data: [85, 85, 85, 92, 92, 92, 87, 87, 87, 90, 90, 90]
      }, {
        name: 'Total Risk Adjusted Members',
        type: 'area',
        data: [6, 22, 30, 36, 40, 46, 50, 52, 54, 60, 68, 70]
      }, {
        name: 'Members Risk Adjusted this Month',
        type: 'column',
        data: [6, 16, 8, 6, 4, 6, 4, 2, 2, 6, 8, 2]
      }],

      chartOptions: {
        chart: {
          type: 'line',
          stacked: false,
        },
        colors: ['#A6FAEC', '#237C7C', '#FAD1C6', '#ED6542'],
        stroke: {
          colors: ['#A6FAEC', '#237C7C', '#ED6542', '#ED6542'],
          width: [1, 3, 1, 0],
          curve: ['smooth', 'smooth', 'straight']
        },
        fill: {
          // colors: ...,
          opacity: [0.4, 1, .8, 1]
        },
        markers: {
          // setting marker size to something really small but greater than 0
          // 1 to work around a bug in the tooltip marker colors
          // which seems to randomly sort the marker colors
          // https://github.com/apexcharts/apexcharts.js/issues/1427
          size: .001, // setting to 0 triggers the bug in this chart
        },
        plotOptions: {
          bar: {
            columnWidth: '50%',
          }
        },
        xaxis: {
          categories: [
            'Jan 2021', 'Feb 2021', 'Mar 2021',
            'Apr 2021', 'May 2021', 'Jun 2021',
            'Jul 2021', 'Aug 2021', 'Sep 2021',
            'Oct 2021', 'Nov 2021', 'Dec 2021'
          ]
        },
        yaxis: {
          title: {
            text: 'Members',
          },
          min: 0,
          max: 110,
          tickAmount: 110/10
        },
        tooltip: {
          shared: true,
          intersect: false,
        }
      },
 cravelight
on 17 Dec 2020
cravelight
on 17 Dec 2020
Related issues
 sdq-sts
·
15Comments
sdq-sts
·
15Comments
 Epithumia
·
17Comments
Epithumia
·
17Comments
 RyanMooreOPS
·
16Comments
RyanMooreOPS
·
16Comments
 richardpolzer
·
24Comments
richardpolzer
·
24Comments
 taheri24
·
19Comments
taheri24
·
19Comments