Apexcharts.js: Column chart : custom the space between bars
Is your feature request related to a problem? Please describe.
I'm frustrated because I don't find the solution to manage easily the space between the bars.

Describe the solution you'd like
A property to change the scale of x/y axes.
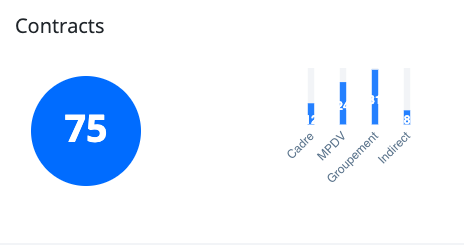
I would like to make thin & tight bars :

Describe alternatives you've considered
I tried to change the plotOptions > bar > columnWidth property, testing with stroke property too, change the grid parameters...
Additional context
Code :
var totalChart = new ApexCharts(document.querySelector("#totalChart"), {
    series: [{
      name: 'Contrats',
      data: $('#totalChart').data('stats').split(',')
    }],
    chart: {
      type: 'bar',
      height: '170px',
      toolbar: { show: false },
      foreColor: '#657a8e',
    },
    plotOptions: {
      bar: {
        horizontal: false,
        columnWidth: '20%',
        distributed: true,
        colors: {
          backgroundBarColors: ['#F2F4F6']
        },
      }
    },
    legend: { show: false },
    xaxis: {
      axisBorder: { show: false },
      axisTicks: { show: false },
      categories: [
        'Cadre', 'MPDV', 'Groupement', 'Indirect'
      ],
      labels: {
        style: {
          fontSize: '12px'
        }
      }
    },
    yaxis: { show: false },
    colors: ['#007BFF'],
    grid: {
      show: false,
    },
    tooltip: {
      y: {
        formatter: function (val) {
          return val;
        }
      }
    }
  });
 eved42
All 8 comments
The columnWidth property should achieve the desired result.
Can you please post a codepen of what you've tried?
 junedchhipa
on 2 Mar 2020
junedchhipa
on 2 Mar 2020
I just noticed that I don't have the same result on Chrome and Firefox with codepen. I don't have a bug on the last label on Chrome in my real project, all the 4 labels are displayed.
No columnWidth just resizes the width of the bars and not resize the space between each bar.
I know when the bars are heavy, there is less space between them but I want thin bars and a small space between them.
eved42
on 3 Mar 2020
@eved42 did you fix your problem?
 StarryFire
on 4 Nov 2020
StarryFire
on 4 Nov 2020
@StarryFire Unfortunately not. I did what I wanted with Bootstrap and progress bars. I don't use apexcharts.js anymore to build my chart.
eved42
on 4 Nov 2020
@StarryFire You can try playing with chart.width and plotOptions.bar.columnWidth both to get different results.
@eved42 If the chart's width is set to 100%, then the bars will try to position themselves as widely as possible.
When the chart's width is reduced, the bars gap is also reduced as shown below.
junedchhipa
on 4 Nov 2020
stroke: {
    colors: ['transparent'],
    width: 2,
}
I was able to add space between the columns/bars using the above stroke property in options. Putting this here so it might help someone else.
StarryFire
on 4 Nov 2020
Just add empty data to series and categories, check your first data before set into options.
Below an example using the minimum of ten data to show.
let data = $('#totalChart').data('stats').split(',')
let categories = ['Cadre', 'MPDV', 'Groupement', 'Indirect']

for (var i = data.length; i <= 10; i++) {
  data.push(0)
  categories.push('')
}
 musasutisna
on 26 Jan 2021
musasutisna
on 26 Jan 2021
The bar width behavior is inconsistent. Setting the columnWidth to 100%, should eliminate the gap between columns, instead the gap exist, it's small, but not constant between each columns (sometimes is 5px, sometimes is 3px, sometimes is 0px and sometimes is even -2px).
 Dinuz
on 6 Apr 2021
Dinuz
on 6 Apr 2021
Related issues
 EroTiXx
·
3Comments
EroTiXx
·
3Comments
 felixalguzman
·
3Comments
felixalguzman
·
3Comments
 tcarlsen
·
3Comments
tcarlsen
·
3Comments
 piyushSinghalDemo
·
3Comments
piyushSinghalDemo
·
3Comments
 jlil
·
3Comments
jlil
·
3Comments
Most helpful comment
I was able to add space between the columns/bars using the above stroke property in options. Putting this here so it might help someone else.