Apexcharts.js: How can I draw an area chart from y.min to y.max values (Range Area Charts)
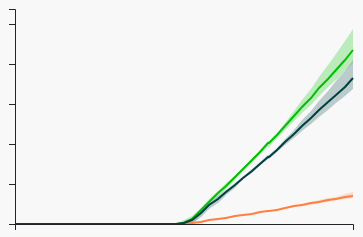
Basic area charts are drawn from x-axis (from zero) to some value, but I need to draw an area of min-max ranges. Someshing like on the attached picture. Can I achieve that with apexcharts?
feature-request
 Dimanoid
👍8
All 6 comments
Are you talking about Range Area Charts?

Sorry, these charts are currently not supported, but I will think of it in future releases.
 junedchhipa
on 31 Oct 2018
junedchhipa
on 31 Oct 2018
👀2
Yes, I was not sure how this kind of charts are "officially" called :)
Would be nice to have such charts, thx.
Dimanoid
on 31 Oct 2018
Hi @junedchhipa !
Do you plan to support this feature in the future? :)
best, Florian
 crazyTweek
on 25 Aug 2020
crazyTweek
on 25 Aug 2020
👍3
+1 😃 🙏
 pvictor
on 5 Nov 2020
pvictor
on 5 Nov 2020
👍4
This would be super helpful to chart technical indicators, like Bollinger Bands. 🤩
 bennycode
on 31 Jan 2021
bennycode
on 31 Jan 2021
👍3
+1
 Florian-Gate
on 7 May 2021
Florian-Gate
on 7 May 2021
Was this page helpful?
0 / 5 - 0 ratings
Related issues
 cstlaurent
·
3Comments
cstlaurent
·
3Comments
 artfulrobot
·
3Comments
artfulrobot
·
3Comments
 piyushSinghalDemo
·
3Comments
piyushSinghalDemo
·
3Comments
 georgehardy
·
3Comments
georgehardy
·
3Comments
 drummad
·
3Comments
drummad
·
3Comments
Most helpful comment
+1 😃 🙏