Angular-cli: Angular 9.0.4 still gives me build error (Regression??)
🐞 bug report
Affected Package
Still related I think with angular/angular#35709
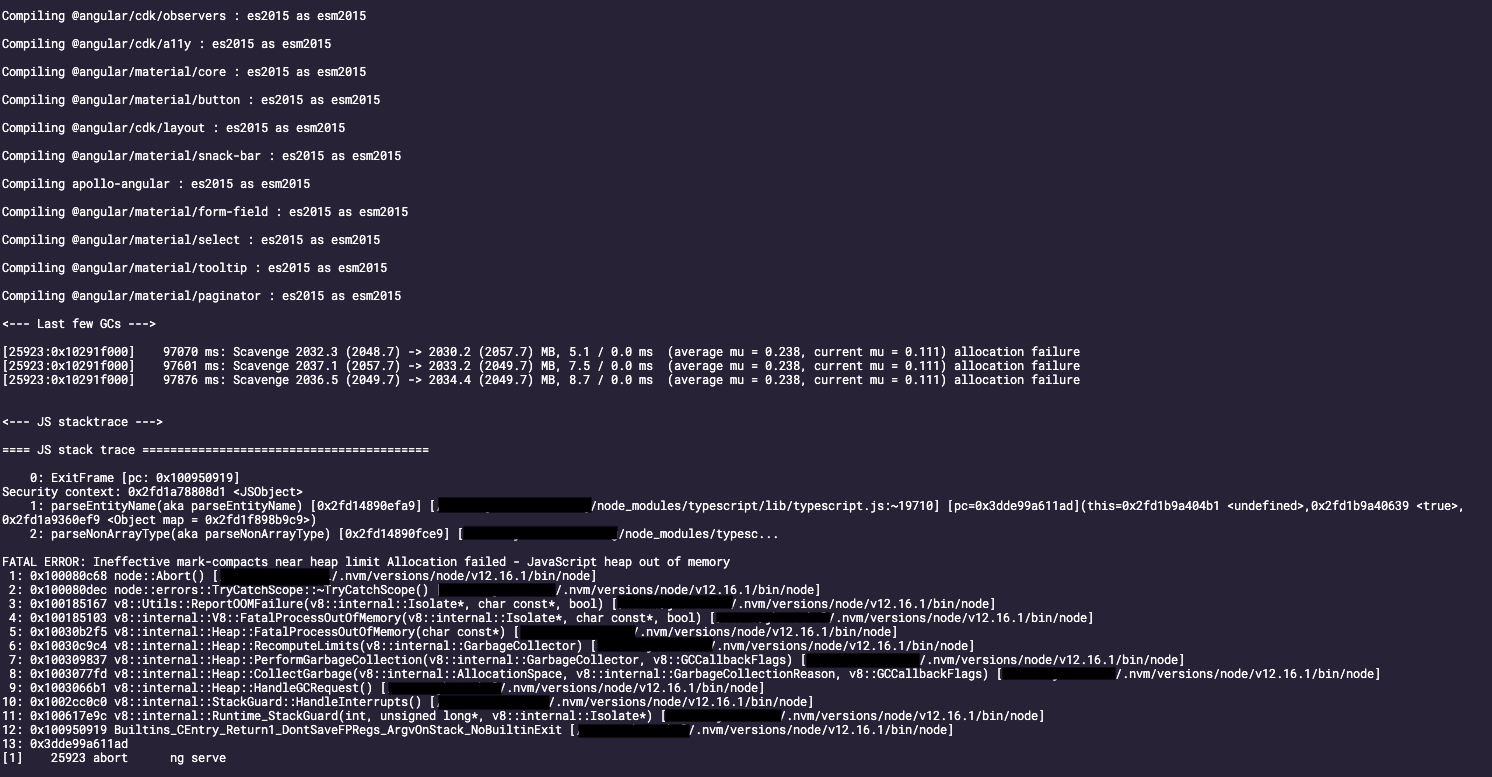
when running ng build

Is this a regression?
Was working in 9.0.2
Description
Similar to yesterdays issue with 9.0.3, after updating to 9.0.4, angular won't build the project anymore.
 AcidSlide
All 19 comments
Your memory is getting out of heap during the build add 'node --max_old_space_size=5120 ./node_modules/@angular/cli/bin/ng build --prod' to package.json script
 Pirateoncrew
on 28 Feb 2020
Pirateoncrew
on 28 Feb 2020
Your memory is getting out of heap during the build add 'node --max_old_space_size=5120 ./node_modules/@angular/cli/bin/ng build --prod' to package.json script
This only happens with Angular 9.0.4
Rolling back to Angular 9.0.2 ng build and ng serve runs with no errors.
AcidSlide
on 28 Feb 2020
This is most likely related to the Angular CLI rather than the Framework. There is a holding issue in that repository to discuss out of memory issues: https://github.com/angular/angular-cli/issues/16860. Please continue the discussion there.
Transferring to CLI repo for their information and triage.
 petebacondarwin
on 28 Feb 2020
petebacondarwin
on 28 Feb 2020
@AcidSlide can you please provide the output of ng version? Also, can you try to update to Node 12?
 alan-agius4
on 28 Feb 2020
alan-agius4
on 28 Feb 2020
+1, same problem for me. I had to rollback to angular 9.0.2.
Dunno, global angular-cli is 9.0.4, the latest version available.
Local devdependencies
"@angular-devkit/build-angular": "0.900.3",
"@angular/cli": "9.0.3",
"@angular/compiler-cli": "9.0.2"
with this configuration, among other angular packages @9.0.2 and [email protected], is working properly.
 artecoop
on 28 Feb 2020
artecoop
on 28 Feb 2020
same here, just npm updated
$ ng version
Angular CLI: 9.0.4
Node: 12.16.1
OS: darwin x64
Angular: 9.0.4
... animations, cli, common, compiler, compiler-cli, core, forms
... language-service, localize, platform-browser
... platform-browser-dynamic, router
Ivy Workspace: Yes
Package Version
-----------------------------------------------------------
@angular-devkit/architect 0.900.4
@angular-devkit/build-angular 0.900.4
@angular-devkit/build-optimizer 0.900.4
@angular-devkit/build-webpack 0.900.4
@angular-devkit/core 9.0.4
@angular-devkit/schematics 9.0.4
@angular/cdk 9.1.0
@angular/material 9.1.0
@ngtools/webpack 9.0.4
@schematics/angular 9.0.4
@schematics/update 0.900.4
rxjs 6.5.4
typescript 3.7.5
webpack 4.41.2
last working ng versionoutput
$ ng version
Angular CLI: 9.0.3
Node: 12.16.1
OS: darwin x64
Angular: 9.0.2
... animations, common, compiler, compiler-cli, core, forms
... language-service, localize, platform-browser
... platform-browser-dynamic, router
Ivy Workspace: Yes
Package Version
-----------------------------------------------------------
@angular-devkit/architect 0.900.3
@angular-devkit/build-angular 0.900.3
@angular-devkit/build-optimizer 0.900.3
@angular-devkit/build-webpack 0.900.3
@angular-devkit/core 9.0.3
@angular-devkit/schematics 9.0.3
@angular/cdk 9.1.0
@angular/cli 9.0.3
@angular/material 9.1.0
@ngtools/webpack 9.0.3
@schematics/angular 9.0.3
@schematics/update 0.900.3
rxjs 6.5.4
typescript 3.7.5
webpack 4.41.2
 3rased
on 28 Feb 2020
3rased
on 28 Feb 2020
@alan-agius4 I confirm this error. It's the same as #17106 and angular/angular#35709.
I had to delete node_modules and reinstall (with npm ci) to fix the error, which was happening with all the third-party libs except Material.
But while the error is gone, during Ivy compilation on first serve/build, my computer heated as hell (which never happen usually, I have a very recent Macbook Pro). I had to close a process in Monitor Activity to make the heat stop. So it's seems there is a memory leak somewhere.
ng version:
Angular CLI: 9.0.4
Node: 12.16.1
OS: darwin x64
Angular: 9.0.4
... animations, cli, common, compiler, compiler-cli, core, forms
... language-service, localize, platform-browser
... platform-browser-dynamic, router, service-worker
Ivy Workspace: Yes
Package Version
------------------------------------------------------------
@angular-devkit/architect 0.900.4
@angular-devkit/build-angular 0.900.4
@angular-devkit/build-ng-packagr 0.900.4
@angular-devkit/build-optimizer 0.900.4
@angular-devkit/build-webpack 0.900.4
@angular-devkit/core 9.0.4
@angular-devkit/schematics 9.0.4
@angular/cdk 9.1.0
@angular/material 9.1.0
@ngtools/webpack 9.0.4
@schematics/angular 9.0.4
@schematics/update 0.900.4
ng-packagr 9.0.0
rxjs 6.5.4
typescript 3.7.5
webpack 4.41.2
 cyrilletuzi
on 28 Feb 2020
cyrilletuzi
on 28 Feb 2020
It's not happening with Angular 9.0.2 and Angular CLI 9.0.4. So the error is on the Angular side.
ng version where it's working:
Angular CLI: 9.0.4
Node: 12.16.1
OS: darwin x64
Angular: 9.0.2
... animations, common, compiler, compiler-cli, core, forms
... language-service, localize, platform-browser
... platform-browser-dynamic, router, service-worker
Ivy Workspace: Yes
Package Version
------------------------------------------------------------
@angular-devkit/architect 0.900.4
@angular-devkit/build-angular 0.900.4
@angular-devkit/build-ng-packagr 0.900.4
@angular-devkit/build-optimizer 0.900.4
@angular-devkit/build-webpack 0.900.4
@angular-devkit/core 9.0.4
@angular-devkit/schematics 9.0.4
@angular/cdk 9.1.0
@angular/cli 9.0.4
@angular/material 9.1.0
@ngtools/webpack 9.0.4
@schematics/angular 9.0.4
@schematics/update 0.900.4
ng-packagr 9.0.0
rxjs 6.5.4
typescript 3.7.5
webpack 4.41.2
just confirming deleting node_modules and doing npm install fixes this for me, my machine still sounds like a jet engine, but node doesn't nope out anymore
3rased
on 28 Feb 2020
Was getting the same error and deleting node_modules and reinstalling with npm ci fixed the issue for me after upgrading to 9.0.4
 ctilley83
on 28 Feb 2020
ctilley83
on 28 Feb 2020
I don't understand, I don't have the error anymore on my local computer (windows), but on my gitlab ci job (docker and linux), I am getting this:
ERROR in Error when flattening the source-map "/builds/applications/frontsxxxx/node_modules/ngx-window-token/ngx-window-token.d.ts.map" for "/builds/applications/fronts/xxxx/node_modules/ngx-window-token/ngx-window-token.d.ts": RangeError: Maximum call stack size exceeded
 stephanecot
on 29 Feb 2020
stephanecot
on 29 Feb 2020
@alan-agius4 sorry I didn't know this was moved to the CLI repo. Full details in https://github.com/angular/angular/issues/35770
Note: Deleting node_modules and reinstalling them via npm install made the issue go away as mentioned by @3rased
AcidSlide
on 1 Mar 2020
@alan-agius4 I confirm this error. It's the same as #17106 and angular/angular#35709.
I had to delete
node_modulesand reinstall (withnpm ci) to fix the error, which was happening with all the third-party libs except Material.But while the error is gone, during Ivy compilation on first serve/build, my computer heated as hell (which never happen usually, I have a very recent Macbook Pro). I had to close a process in Monitor Activity to make the heat stop. So it's seems there is a memory leak somewhere.
This was also happening to me. I macbook pro fans gets angry (literally sounding like a small vacuum cleaner was running inside my mbp) which never happened before during building projects prior to 9.0.4.
Which by the way, I have a beefed up MBP setup.
AcidSlide
on 1 Mar 2020
Hi all, is there a way to provide a reproduction for this? Unfortunately, it's pretty hard to determine what is happening and address the problem without a reproduction.
@AcidSlide / @cyrilletuzi are you running ngcc using the postinstall hook?
alan-agius4
on 11 Mar 2020
Hi all, is there a way to provide a reproduction for this? Unfortunately, it's pretty hard to determine what is happening and address the problem without a reproduction.
@AcidSlide / @cyrilletuzi are you running
ngccusing the postinstall hook?
I think:
- create a project with angular @9.0.2 and a custom lib ==> install ==> OK
- updade to 9.0.3 ==> install ==> it break
- update to 9.0.4 (or 9.0.5 ?) ==> install ==> still break
- (For me) Delete /node_modules, /dist and package-lock.json ==> installl ==> working
stephanecot
on 11 Mar 2020
@alan-agius4 ngcc is running automatically, ie. on first build or serve after a ng update or npm ci.
Since v9.0.4/9.0.5 I didn't see a build error again, but the overheating stuff is still happening on first build/serve. On Mac, in Activity Monitor, it's a "Code Helper" (for VS Code) which is taking 100% of CPU and which is not killed even when closing VS Code.
cyrilletuzi
on 11 Mar 2020
Have same problem with 9.0.5 and preboot package. I use Angular 9.0.5 and Node 12.10. Clearing of node_modules is not helped.
Compiling preboot : es2015 as esm2015
Compiling preboot : module as esm5

<--- Last few GCs --->

[85873:0x10280c000]   162112 ms: Mark-sweep 2045.4 (2051.0) -> 2044.9 (2051.3) MB, 1419.3 / 0.0 ms  (average mu = 0.086, current mu = 0.001) allocation failure scavenge might not succeed
[85873:0x10280c000]   163455 ms: Mark-sweep 2045.6 (2051.3) -> 2045.1 (2051.5) MB, 1340.4 / 0.0 ms  (average mu = 0.044, current mu = 0.001) allocation failure scavenge might not succeed

<--- JS stacktrace --->

==== JS stack trace =========================================

    0: ExitFrame [pc: 0x1009288f9]
Security context: 0x196d5afc0919 <JSObject>
    1: parseMappings(aka parseMappings) [0x196d188c7e91] [/path_to_proj/node_modules/@angular/compiler-cli/ngcc/src/sourcemaps/source_file.js:~270] [pc=0x2c7b297e04c1](this=0x196da4b004d1 <undefined>,0x196d80f16a59 <Object map = 0x196dc9f558f9>,0x196d80f16f39 <JSArray[1]>)
    2: /* anonymous */(aka /* anonymous */) [0x196de305a309] [/...

FATAL ERROR: Ineffective mark-compacts near heap limit Allocation failed - JavaScript heap out of memory
And I got the same for angular-draggable-droppable package as well.
==== JS stack trace =========================================

    0: ExitFrame [pc: 0x1009288f9]
    1: StubFrame [pc: 0x10092a5c2]
    2: StubFrame [pc: 0x10090825e]
Security context: 0x30ba420c0919 <JSObject>
    3: split [0x30ba420ccf49](this=0x30ba27d14049 <Very long string[9647]>,0x30ba27d14069 <JSRegExp <String[#5]: \r?\n>>)
    4: computeLineLengths(aka computeLineLengths) [0x30ba84847ff1] [/path_to_proj/node_modules/@angular/compiler-cli/ngcc/src/sourcemaps/source_f...

FATAL ERROR: Ineffective mark-compacts near heap limit Allocation failed - JavaScript heap out of memory
I got it with Angular 9.0.5. With Angular 9.0.2 all works fine.
 ottodranik
on 12 Mar 2020
ottodranik
on 12 Mar 2020
I have also the same effect as @ottodranik with angular-calendar -> angular-draggable-droppable with 9.0.6 Nodejs 12.16.1 (before I think 12.15.0 also). System is Win10.
Removing node_modules and npm i doesn't work.
...
Compiling angular-draggable-droppable : fesm5 as esm5
Compiling angular-draggable-droppable : esm2015 as esm2015
Compiling angular-draggable-droppable : main as umd
Compiling angular-resizable-element : fesm5 as esm5
Compiling angular-draggable-droppable : esm5 as esm5
Compiling angular-resizable-element : esm2015 as esm2015
Compiling angular-resizable-element : esm5 as esm5
Compiling angular-resizable-element : main as umd
Compiling angular-calendar : fesm5 as esm5
Compiling angular-calendar : esm5 as esm5
Compiling angular-calendar : esm2015 as esm2015
Compiling angular-calendar : main as umd
Compiling angular-calendar : fesm2015 as esm2015

<--- Last few GCs --->

[23624:00000286B75E0A80]   176928 ms: Mark-sweep 2045.4 (2050.7) -> 2044.9 (2050.7) MB, 777.5 / 0.0 ms  (average mu = 0.099, current mu = 0.011) allocation failure scavenge might not succeed
[23624:00000286B75E0A80]   178710 ms: Mark-sweep 2045.7 (2051.0) -> 2045.0 (2051.2) MB, 1562.2 / 0.0 ms  (average mu = 0.113, current mu = 0.124) allocation failure scavenge might not succeed


<--- JS stacktrace --->

==== JS stack trace =========================================

Security context: 0x0069ac8408d1 <JSObject>
    0: builtin exit frame: parse(this=0x0069ac85ec89 <Object map = 0000017AA21C3549>,0x036e7aec0119 <Very long string[149077]>,0x0069ac85ec89 <Object map = 0000017AA21C3549>)

    1: loadSourceMap [00000224FBA3AD01] [xxx\node_modules\@angular\compiler-cli\ngcc\src\sourcemaps\source_file_loader.js:~73] [pc=0000003AD9DC2828](this=0x00250813ffd1 <SourceFileLoader map = 00000...

FATAL ERROR: Ineffective mark-compacts near heap limit Allocation failed - JavaScript heap out of memory
 1: 00007FF7F42E363F napi_wrap+128063
 2: 00007FF7F4282836 v8::base::CPU::has_sse+35142
 3: 00007FF7F42834F6 v8::base::CPU::has_sse+38406
 4: 00007FF7F4A99F4E v8::Isolate::ReportExternalAllocationLimitReached+94
 5: 00007FF7F4A82021 v8::SharedArrayBuffer::Externalize+833
 6: 00007FF7F494E57C v8::internal::Heap::EphemeronKeyWriteBarrierFromCode+1436
 7: 00007FF7F49597D0 v8::internal::Heap::ProtectUnprotectedMemoryChunks+1312
 8: 00007FF7F49562F4 v8::internal::Heap::PageFlagsAreConsistent+3204
 9: 00007FF7F494BB13 v8::internal::Heap::CollectGarbage+1283
10: 00007FF7F494A184 v8::internal::Heap::AddRetainedMap+2452
11: 00007FF7F4971CAB v8::internal::Factory::NewRawOneByteString+91
12: 00007FF7F4891225 v8::internal::TimedHistogram::Stop+52789
13: 00007FF7F4892C5E v8::internal::TimedHistogram::Stop+59502
14: 00007FF7F489155A v8::internal::TimedHistogram::Stop+53610
15: 00007FF7F4A13219 v8::internal::Builtins::builtin_handle+83385
16: 00007FF7F4A1376E v8::internal::Builtins::builtin_handle+84750
17: 00007FF7F4EE4EDD v8::internal::SetupIsolateDelegate::SetupHeap+546893
18: 0000003AD9DC2828
Warning: Worker #5 exited unexpectedly (code: 134 | signal: null).
  Current assignment: {entryPoint: angular-draggable-droppable, formatProperty: main, processDts: false}
...
Using our docker build image with mounted dir compilation works and also when I downgrade @angular/compiler-cli to 9.0.2.
also same error in 9.1.0
0: ExitFrame [pc: 00007FF7C02A4DDD]
Security context: 0x0293d7ac08d1
1: parseMappings(aka parseMappings) [0000011F81344141] [xxxnode_modules\@angular\compiler-clingccsrcsourcemapssource_file.js:~287] pc=00000001ED55D58C
2: new SourceFile [0000011F813...
setting NODE_OPTIONS to --max_old_space_size=8192 solved the issue.
 mosesonline
on 12 Mar 2020
mosesonline
on 12 Mar 2020
This issue has been automatically locked due to inactivity.
Please file a new issue if you are encountering a similar or related problem.
Read more about our automatic conversation locking policy.
_This action has been performed automatically by a bot._
![angular-automatic-lock-bot[bot] picture](https://avatars0.githubusercontent.com/in/40213?v=4&s=40) angular-automatic-lock-bot[bot]
on 7 May 2020
angular-automatic-lock-bot[bot]
on 7 May 2020
Related issues
 hareeshav
·
3Comments
hareeshav
·
3Comments
 daBishMan
·
3Comments
daBishMan
·
3Comments
 rajjejosefsson
·
3Comments
rajjejosefsson
·
3Comments
 MateenKadwaikar
·
3Comments
MateenKadwaikar
·
3Comments
 IngvarKofoed
·
3Comments
IngvarKofoed
·
3Comments
Most helpful comment
Have same problem with 9.0.5 and
prebootpackage. I use Angular 9.0.5 and Node 12.10. Clearing of node_modules is not helped.And I got the same for
angular-draggable-droppablepackage as well.I got it with Angular 9.0.5. With Angular 9.0.2 all works fine.