Angular-cli: How to add `--inspect-brk` to `ng e2e` so we can debug protractor tests while using node 8?
In order to debug protractor tests with node 8 and above, the protractor docs suggest adding --inspect-brk when running tests.
node --inspect-brk bin/protractor <config_file>
How do we add that option when running ng e2e?
 rjsteinert
All 8 comments
The protractor docs seem aimed mainly at AngularJS applications... some clarity would be nice here
 hevans90
on 5 Jun 2018
hevans90
on 5 Jun 2018
After some experimentation I managed to get this to work, using the following (disgusting) command:
node --inspect-brk ./node_modules/\@angular/cli/bin/ng e2e ./protractor.conf.js
I ran this in the root of my Angular 6 application, after which my terminal spat this out:

And nothing appeared to happen... until I opened a chrome tab on: chrome://inspect/#devices:

Clicking inspect above opens an instance of DevTools and immediately breaks the code at the top of the ng module. Hit continue in your debugger to run your e2e tests, and hit any debugger statements in your code!
Happy e2e-ing :)
hevans90
on 5 Jun 2018
@hevans90
If don't want it to break on the first line change inspect-brk to inspect
Anyway, I can't get it to work. I need to add --protractor-config (and the path because my conf file is in ./e2e/)
node --inspect-brk ./node_modules/\@angular/cli/bin/ng e2e --protractor-config ./e2e/protractor.conf.js
The error I then get is:
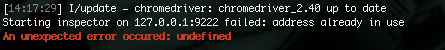
I tried to specify a different host:
node --inspect-brk=9222 ./node_modules/\@angular/cli/bin/ng e2e --protractor-config ./e2e/protractor.conf.js
and
node --inspect-brk=9222 ./node_modules/\@angular/cli/bin/ng e2e --protractor-config ./e2e/protractor.conf.js --host=9223
The first would give exactly the same error as the screenshot, the second gives:

Some help would be appreciated :-(
An off-the-shelve solution in angular-cli would be appreciated too!
 maurei
on 14 Jun 2018
maurei
on 14 Jun 2018
The following did the trick for me:
node --inspect-brk ./node_modules/protractor/bin/protractor ./e2e/protractor.conf.js
maurei
on 15 Jun 2018
The --inspect* options get stripped by the CLI.
But I modified those lines, first to ignore --inspect=0, then to just explicitly add --inspect-brk, and neither one worked, so something else seems to be going on here. I even tried adding NODE_OPTIONS: '--inspect--brk=0' to the env forkOptions.
In the mean time you can use this to manually launch protractor in debug mode:
NODE_OPTIONS=--inspect-brk node_modules/.bin/protractor e2e/protractor.conf.js --baseUrl=http://localhost:4200/
You will have to run ng serve separately
 james-schwartzkopf
on 16 Aug 2018
james-schwartzkopf
on 16 Aug 2018
The following did the trick for me:
node --inspect-brk ./node_modules/protractor/bin/protractor ./e2e/protractor.conf.js
This one is the only solution that worked for me! Thanks!
 pepebbs
on 4 Apr 2019
pepebbs
on 4 Apr 2019
After some experimentation I managed to get this to work, using the following (disgusting) command:
node --inspect-brk ./node_modules/\@angular/cli/bin/ng e2e ./protractor.conf.jsI ran this in the root of my Angular 6 application, after which my terminal spat this out:
And nothing appeared to happen... until I opened a chrome tab on:
chrome://inspect/#devices:
Clicking inspect above opens an instance of DevTools and immediately breaks the code at the top of the
ngmodule. Hit continue in your debugger to run your e2e tests, and hit anydebuggerstatements in your code!Happy e2e-ing :)
Hi, I am little confused, this command need to hit along with ng test?
 ermarkar
on 17 Aug 2019
ermarkar
on 17 Aug 2019
node --inspect-brk
how can i use the ng e2e command with 'options' like below ?
"e2e-debug": "node --inspect-brk .\\node_modules\\@angular\\cli\\bin\\ng e2e -c=integration --suite e2e --webdriverUpdate=false .\\e2e\\protractor.conf.js"
I get
Unknown option: '.\e2e\protractor.conf.js'
error and test doesn't resume after hitting first line of ng.
if I remove .\e2e\protractor.conf.js from above command, test resumes after hitting first line of ng, but doesn't stop at any place where debugger is added in spec file.
 codertube
on 5 Sep 2020
codertube
on 5 Sep 2020
Related issues
 5amfung
·
3Comments
5amfung
·
3Comments
 naveedahmed1
·
3Comments
naveedahmed1
·
3Comments
 MateenKadwaikar
·
3Comments
MateenKadwaikar
·
3Comments
 daBishMan
·
3Comments
daBishMan
·
3Comments
 purushottamjha
·
3Comments
purushottamjha
·
3Comments
Most helpful comment
After some experimentation I managed to get this to work, using the following (disgusting) command:
node --inspect-brk ./node_modules/\@angular/cli/bin/ng e2e ./protractor.conf.jsI ran this in the root of my Angular 6 application, after which my terminal spat this out:
And nothing appeared to happen... until I opened a chrome tab on:
chrome://inspect/#devices:Clicking inspect above opens an instance of DevTools and immediately breaks the code at the top of the
ngmodule. Hit continue in your debugger to run your e2e tests, and hit anydebuggerstatements in your code!Happy e2e-ing :)