Angular-cli: No sourcemaps generated for 'ng serve' with angular-cli 1.5.2
Sourcemaps stopped working for dev builds using ng serve in my app after upgrading to angular-cli 1.5.
I tested this by creating a pristine project and the same thing happens, there seem to be no sourcemaps available over the development server. A regular ng build does create the .map files.
Versions
Angular CLI: 1.5.2
Node: 8.4.0
OS: win32 x64
Angular: 5.0.2
... animations, common, compiler, compiler-cli, core, forms
... http, language-service, platform-browser
... platform-browser-dynamic, router

@angular/cli: 1.5.2
@angular-devkit/build-optimizer: 0.0.33
@angular-devkit/core: 0.0.20
@angular-devkit/schematics: 0.0.36
@ngtools/json-schema: 1.1.0
@ngtools/webpack: 1.8.2
@schematics/angular: 0.1.5
typescript: 2.4.2
webpack: 3.8.1
Repro steps
- Step 1
npm install -g @angular/cli - Step 2
ng g test-app
cd test-app
- Step 3
ng serve
Observed behavior
No sourcemaps are availbale over the dev server.
e.g. http://localhost:4200/main.bundle.js.map -> 404 not found
 phillashworth
All 19 comments
Development targets now use a different type of source map that is integrated into the JS bundle. For production standard soucemap files are still generated.
 clydin
on 17 Nov 2017
clydin
on 17 Nov 2017
Thanks @clydin, the browser debugger (Chrome or Firefox) does not seem to pick up these integrated source maps and just displays the minified code. I'm not sure how to go about debugging the code, setting breakpoints etc. Any suggestions would be much appreciated.
phillashworth
on 17 Nov 2017
Happens to me too.
A workaround is to ng build your project, which still generate the map files, and then serve from the dist directory with http-server, for example.
No really classy.. but until they fix the issue, it helps
 pmullot
on 21 Nov 2017
pmullot
on 21 Nov 2017
Just to be sure we're looking in the same place, do you not get these sources in the browser debugger?

If you add debugger; to main.ts does the breakpoint not show?
 filipesilva
on 24 Nov 2017
filipesilva
on 24 Nov 2017
@filipesilva I have always set my breakpoints in the code shown under localhost:4200 -> main.bundle.js which previously displayed the un-minified code, but now with 1.5.0+ it shows minified.
I was not aware that I could set them under webpack:// and now I have tried that as per your screenshot it works perfectly. So looks like a non-issue, thanks for looking into it and pointing me in the right direction.

phillashworth
on 24 Nov 2017
@phillashworth cool, glad to hear it's sorted for you. I'll leave the issue open for a while to see if other users are also ok.
filipesilva
on 24 Nov 2017
@filipesilva, the workaround of using sources under the webpack:// node is working in Chrome/FF, but it isn't great because 'Search all sources' doesn't work. You have to navigate webpack:// tree every time you need to set a breakpoint instead of quickly searching for desired line across your project in browser's DevTools.
 AbakumovAlexandr
on 24 Nov 2017
AbakumovAlexandr
on 24 Nov 2017
From what I can tell, this setup doesn't allow debugging from VS Code. Is that correct?
 aciccarello
on 20 Dec 2017
aciccarello
on 20 Dec 2017
I have an application which has both Angular 1.6 .js files and Angular 5 .ts files (using UpgradeModule)
With the files created with ng build I can easily find and debug the .js files of the application.
But when running ng serve I only get the .ts files.
If there isn't something else I can do to debug these js files (except serving the content from the built version) I think there should be an option to still create map files with ng serve.
Edit: Fixed it by editing node_modules/@angular/cli/commands/serve.js and changing commandOptions.evalSourcemaps to false
 Eblax
on 4 Jan 2018
Eblax
on 4 Jan 2018
Can we get the evalSourcemaps boolean flag surfaced as a switch so I can set it to false in my dev environment? I seem to be unique and have a customer that debugs with breakpoints in Visual Studio - which worked fine until Cli 1.5 and the change to always use the webpack.EvalSourceMapDevToolPlugin for development.
 JasonHaley
on 8 Feb 2018
JasonHaley
on 8 Feb 2018
@aciccarello Have you worked out debugging in VSCODE yet? I'm not able to set breakpoints with the "Breakpoint ignored because generated code not found (source map problem?)" I'm on a new machine, this worked on my previous dev machine. (Windows)
 kdubious
on 26 Feb 2018
kdubious
on 26 Feb 2018
@filipesilva I'm not seeing the "File path" as the third node under webpack, I see just a "."
kdubious
on 26 Feb 2018
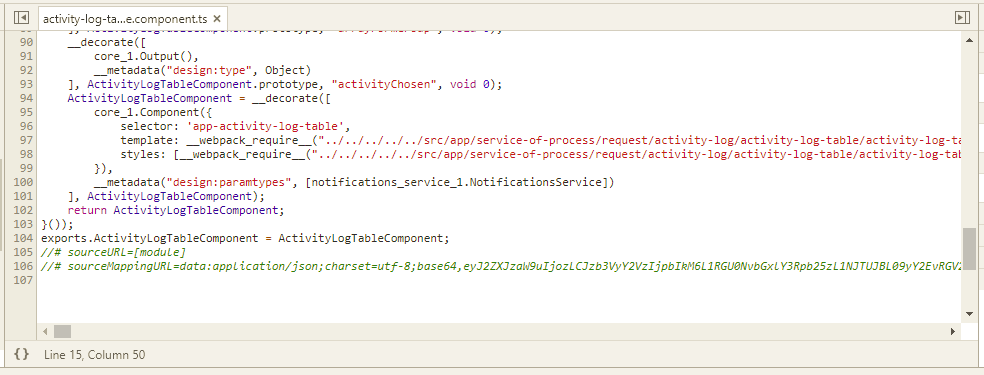
I've been facing this issue in Chrome since then as well. We're using ng serve -ec -o. The source maps are available in the webpack:// tree, but when searching for them using Ctrl+P (Windows) the resulting file looks like this (transpiled JS):
As soon as we click to set a breakpoint, it instantly swaps in the TS source, like this:

 Da13Harris
on 8 Mar 2018
Da13Harris
on 8 Mar 2018
I have created a new ASP.NET Core 2.0 application using the angular template but I am unable to hit breakpoints set in VS2017 since VS doesn't appear to be able to find the integrated sourcemaps.
Downgrading to angular/cli @ 1.4.9 solves this problem and I can hit breakpoints and debug as expected.
Is there a flag I can use to generate standard sourcemaps via ng serve? Or is there something I can do to instruct VS to pick up the integrated sourcemaps?
Thanks.
 stuartdsmith
on 13 Mar 2018
stuartdsmith
on 13 Mar 2018
I'm using Angular CLI 1.6.8 and had the same issue until I tried @Eblax solution of commandOptions.evalSourcemaps to false (Thank you! but I'm not quite clear on what this option does).
I'm with @stuartdsmith which is exactly what I hope to have working. I spent a lot of time trying getting VS debugging to work until I found the evalSourceMaps fix above.
 dtabaka
on 18 Mar 2018
dtabaka
on 18 Mar 2018
Have you guys seen this:
https://github.com/angular/angular-cli/issues/9729#issuecomment-373232983
There's a launch.json setting that seems to help.
kdubious
on 20 Mar 2018
Setting commandOptions.evalSourcemaps to false as @Eblax suggested also allowed me to debug TypeScript files in the Windows F12 tools (C:\Windows\SysWOW64\F12\F12Chooser.exe) for an Office add-in. Thanks!
 tmmueller
on 20 Apr 2018
tmmueller
on 20 Apr 2018
I could not reproduce with latest master. We changed webpack version and did a lot of changes overall to the webpack config, including sourcemap generation by default. Closing this as fixed.
 hansl
on 28 Sep 2018
hansl
on 28 Sep 2018
This issue has been automatically locked due to inactivity.
Please file a new issue if you are encountering a similar or related problem.
Read more about our automatic conversation locking policy.
_This action has been performed automatically by a bot._
![angular-automatic-lock-bot[bot] picture](https://avatars0.githubusercontent.com/in/40213?v=4&s=40) angular-automatic-lock-bot[bot]
on 8 Sep 2019
angular-automatic-lock-bot[bot]
on 8 Sep 2019
Related issues
 rwillmer
·
3Comments
rwillmer
·
3Comments
 NCC1701M
·
3Comments
NCC1701M
·
3Comments
 hartjo
·
3Comments
hartjo
·
3Comments
 IngvarKofoed
·
3Comments
IngvarKofoed
·
3Comments
 brtnshrdr
·
3Comments
brtnshrdr
·
3Comments
Most helpful comment
Thanks @clydin, the browser debugger (Chrome or Firefox) does not seem to pick up these integrated source maps and just displays the minified code. I'm not sure how to go about debugging the code, setting breakpoints etc. Any suggestions would be much appreciated.