Amazon-vpc-cni-k8s: Slowly growing RAM usage by aws-node version 1.6.3/1.7.2
What happened:
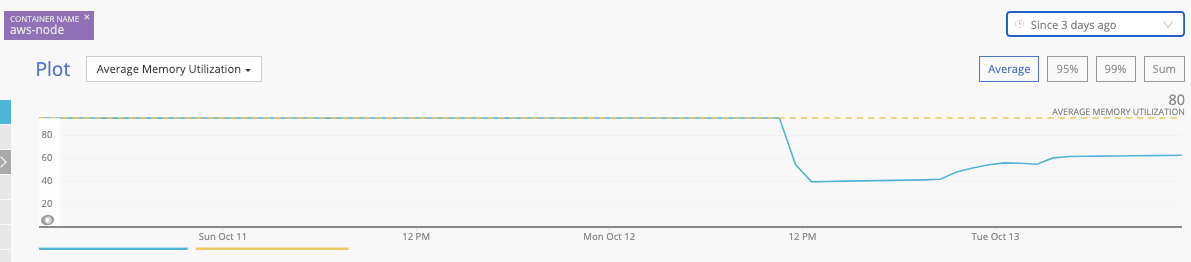
We have found that the RAM usage slowly grows for aws-node DaemonSet after upgrading to 1.6.3 version.
See below the usage grow for last month.

We had set resource protection for aws-node (request & limit of 128Mb) and got alert in NewRelic when it reached close to 100% usage.
Is this behaviour expected? It wasn't the case before EKS upgrade to version 1.16.
Does anyone know the recommended value for RAM limit ?
Environment:
- Kubernetes version (use
kubectl version):
v1.16.13-eks-2ba888 - CNI Version
1.6.3
Docker image: 602401143452.dkr.ecr.eu-west-1.amazonaws.com/amazon-k8s-cni:v1.6.3-eksbuild.1 - OS (e.g:
cat /etc/os-release):
$ cat /etc/os-release
NAME="Amazon Linux"
VERSION="2"
ID="amzn"
ID_LIKE="centos rhel fedora"
VERSION_ID="2"
PRETTY_NAME="Amazon Linux 2"
ANSI_COLOR="0;33"
CPE_NAME="cpe:2.3:o:amazon:amazon_linux:2"
HOME_URL="https://amazonlinux.com/"
- Kernel (e.g.
uname -a):
 uname -a
Linux ip-10-***-***-***.eu-west-1.compute.internal 4.14.193-149.317.amzn2.x86_64 #1 SMP Thu Sep 3 19:04:44 UTC 2020 x86_64 x86_64 x86_64 GNU/Linux
 Constantin07
All 13 comments
Hi @Constantin07
Can you please email ([email protected]) me the logs, you can run -sudo bash /opt/cni/bin/aws-cni-support.sh. I would like to check the ipamd logs to understand the scale, any churns and if any errors are seen while freeing up the resources.
Thank you!
 jayanthvn
on 13 Oct 2020
jayanthvn
on 13 Oct 2020
Hi @jayanthvn
I have already bumped the version of aws-node up to 1.7.2 as per https://docs.aws.amazon.com/eks/latest/userguide/update-cluster.html so cannot post the for logs for 1.6.3.
But interestingly, even for 1.7.2 it still slowly grows.
I've sent you the run results for 1.7.2.
Thanks
Constantin07
on 13 Oct 2020
Thanks @Constantin07. I have got the logs file. Will review it and get back to you asap.
jayanthvn
on 13 Oct 2020
@jayanthvn any updates ? The memory is again growing and have reached the warning limit.
PS: We have configured the resources request & limit as 128M at the moment. Does anyone have an idea how much aws-node should be allocated ?
Constantin07
on 20 Oct 2020
Hi @Constantin07
We are actively looking into it. Will have an update asap. Thanks for your patience.
jayanthvn
on 20 Oct 2020
Hello @jayanthvn
Any update on this? We just upgraded to 1.7.5 and are still seeing this issue.
kubectl describe daemonset aws-node --namespace kube-system | grep Image | cut -d "/" -f 2
amazon-k8s-cni-init:v1.7.5
amazon-k8s-cni:v1.7.5
 hasselrot
on 25 Nov 2020
hasselrot
on 25 Nov 2020
After speaking to NewRelic support the following has been clarified:
kubectl -n kube-system top pod aws-node-xxxx which relies on metrics-server doesn't show memory usage increase over time.
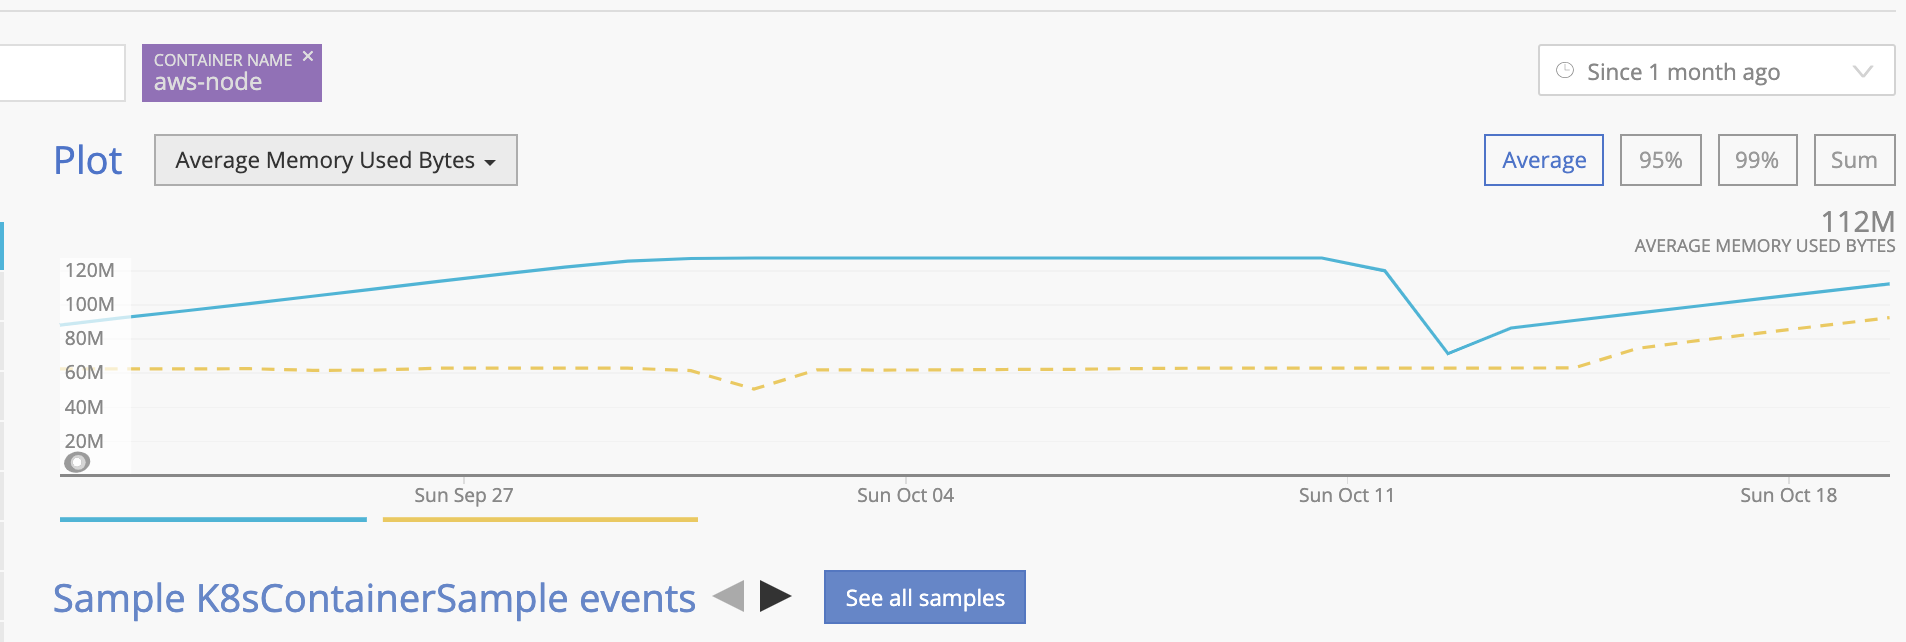
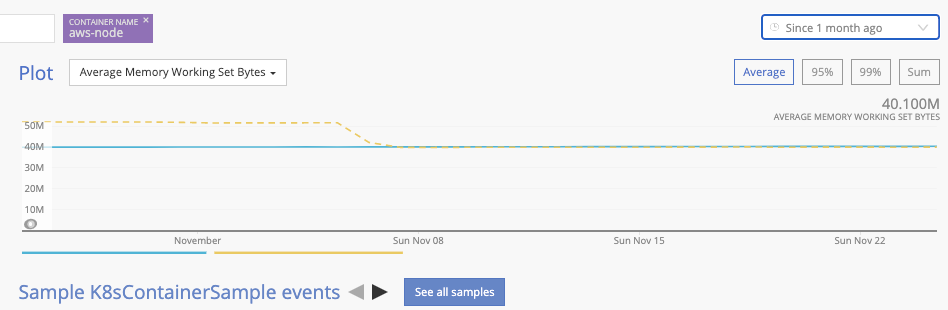
NewRelic's memoryUsedBytes metric includes Linux buffers and cache (based on /stats/summary) - that's what we see in the above graphs. Instead, we need to rely on memoryWorkingSetBytes metric. More details here.
Make sure to base any alert conditions on memoryWorkingSetBytes metric to avoid false alarms.
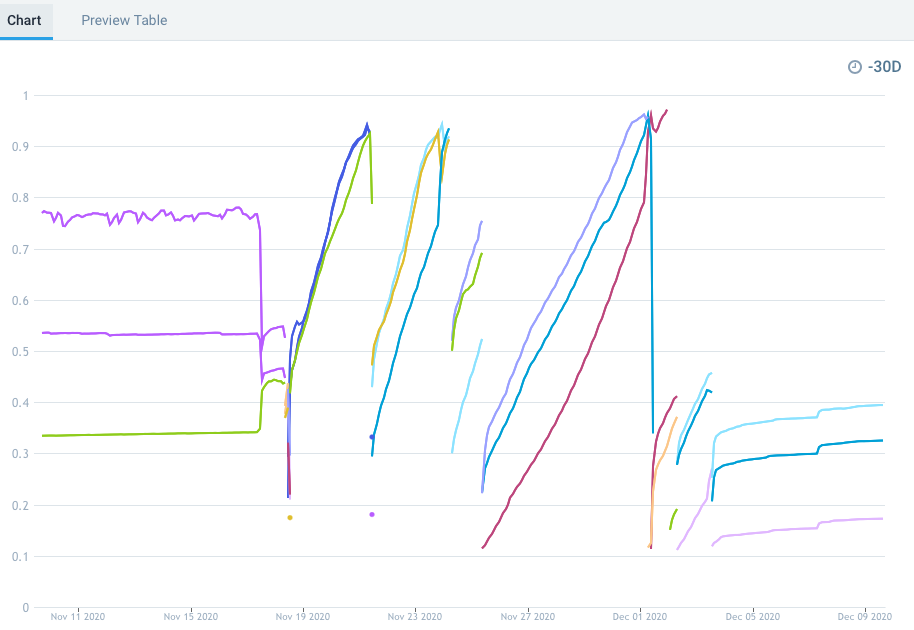
Here is the stat for the past 30 days.
@jayanthvn Thanks for looking into.
Constantin07
on 25 Nov 2020
@Constantin07 That is very good to know!
Tricky metrics!
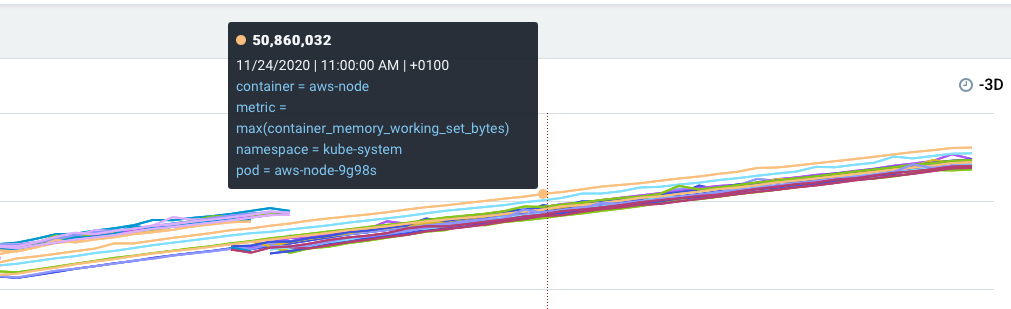
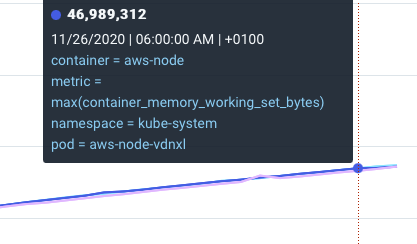
My graph is showing the memoryWorkingSetBytes, and its clear that there is a difference when we upgraded:
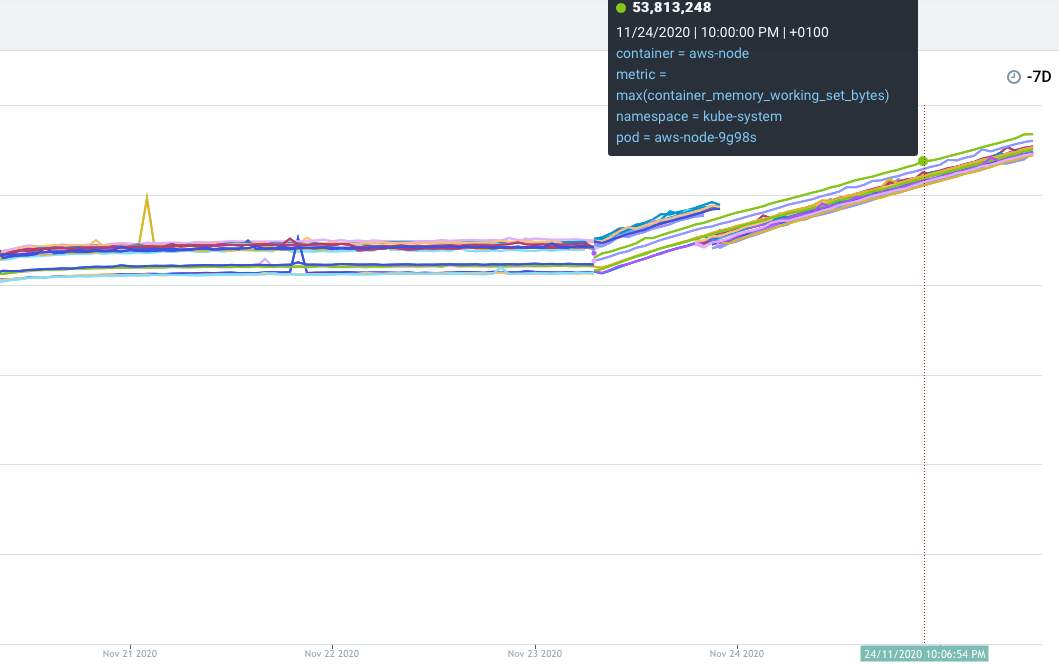
From being fairly flat, the same metric just keeps growing.
hasselrot
on 25 Nov 2020
@hasselrot
Thanks for providing the screenshots. Would you be able to use metrics server to verify the memory growing? If you haven't installed metrics server, you can refer to https://docs.aws.amazon.com/eks/latest/userguide/metrics-server.html. If you have issue to get metrics, please refer to this issue https://github.com/kubernetes-sigs/metrics-server/issues/237. Please let us know how that looks like. Also could you share which version you were on before updating to 1.7.5. Thanks.
 haouc
on 25 Nov 2020
haouc
on 25 Nov 2020
@haouc thanks for taking the time to help!
We were running on version: AWS CNI Plugin: amazon-k8s-cni:v1.6.0 before the upgrade.
I have installed the metrics server as well.
When comparing the results of my graph:
With the result of kubectl top:
NAME             CPU(cores)   MEMORY(bytes)
aws-node-2dctx   1m           45Mi
NAME             CPU(cores)   MEMORY(bytes)
aws-node-vdnxl   1m           45Mi
NAME             CPU(cores)   MEMORY(bytes)
aws-node-wxnnv   2m           45Mi
It seems that the graph is correctly showing the same metric.
hasselrot
on 26 Nov 2020
@hasselrot sorry for a late response. Have you seen the same increase on aws-node memory usage if monitoring on kubectl top? We are preferring to monitoring aws-node memory usage exposed by metrics server metrics API. If aws-nodes were not restarted, would you be able to update with the latest memory usage data from metrics sever comparing with the data from two weeks ago.
For the screenshot you provided recently, was that scraped from the cAdvisor endpoint? Could you share which tool you used to collect them? Thanks.
haouc
on 9 Dec 2020
@haouc Thank you for your reply! I have been working with AWS Support on this and it looks much better now.
What we tried first was to downgrade the CNI to 1.6, but that did not help.
We then realized that we were running an AMI that had been recalled ([RECALLED] AMI Release v20201112).
When we upgraded to the latest AMI, the problem went away. We then upgraded the CNI again to the latest, and has much less memory increase now.
It still seems to creep a little bit upwards, but this does not make me worried.
See screenshot (memory usage per node). The bump on the line to the right is when we upgraded CNI.
Until we have seen how this behaves on a longer period, I think we can close this issue.
hasselrot
on 9 Dec 2020
Sounds good, @hasselrot. I noticed we have a support ticket for this issue. Glad the potential cause has been identified. Yes, please feel free to close this ticket when you think the issue has been solved. Thanks.
haouc
on 10 Dec 2020
Related issues
 tirumerla
·
5Comments
tirumerla
·
5Comments
 dhoeld
·
4Comments
dhoeld
·
4Comments
 marcincuber
·
4Comments
marcincuber
·
4Comments
 rakesh-nd
·
3Comments
rakesh-nd
·
3Comments
 shonik09
·
4Comments
shonik09
·
4Comments