Alertmanager: Alert manager goes from Firing->Resolved->Firing
What did you do?
Started the prometheus followed by the alert manger.
What did you expect to see?
Expect to see alerts go off once everyday unless they are resolved for some time and then became firing again.
What did you see instead? Under which circumstances?
I only use alert manager(for now) to monitor if machine is down/up and if any disk locations I monitor goes above threshold . At first I only had disk usage being alerted. At which point, I was getting notifications all the time during the day, my disk space issue is resolved , but then couple of minutes later, it became firing again. I thought this is because the usage was very close to the threshold level. And it might have resolved for some time. But then I started monitoring machine up/down status as well, I started getting alerts saying machines being down resolved. But these are machines that does not even have the prometheus exporter running. So they were never up/resolved.
So the problem is alert manager goes from Firing->Resolved->Firing often. I think it has to do with alert manager itself.
Environment
System information:
insert output of
uname -srmhere:Linux 4.15.0-20-generic x86_64Alertmanager version:
alertmanager, version 0.15.2 (branch: HEAD, revision: d19fae3bae451940b8470abb680cfdd59bfa7cfa)
  build user:       root@3101e5b68a55
  build date:       20180814-10:53:39
  go version:       go1.10.3
- Prometheus version:
prometheus, version 2.2.1 (branch: HEAD, revision: bc6058c81272a8d938c05e75607371284236aadc)
  build user:       root@149e5b3f0829
  build date:       20180314-14:15:45
  go version:       go1.10
- Alertmanager configuration file:
global:
  slack_api_url: 'https://hooks.slack.com/services/notTheRealDealBoi'
templates:
- '/etc/alertmanager/template/*.tmpl'
- './slack_title.tmpl' # This is the custom template we wrote

# The root route on which each incoming alert enters.
route:
  # The labels by which incoming alerts are grouped together. For example,
  # multiple alerts coming in for cluster=A and alertname=LatencyHigh would
  # be batched into a single group.
  group_by: ['instance', 'alertname']

  # When a new group of alerts is created by an incoming alert, wait at
  # least 'group_wait' to send the initial notification.
  # This way ensures that you get multiple alerts for the same group that start
  # firing shortly after another are batched together on the first
  # notification.
  #group_wait: 30s

  # When the first notification was sent, wait 'group_interval' to send a batch
  # of new alerts that started firing for that group.
  group_interval: 1m

  # If an alert has successfully been sent, wait 'repeat_interval' to
  # resend them.
  repeat_interval: 24h

  receiver: machine-status-slack-notifications # Default receiver

  routes:
  - match:
      alertname: gsa-fs-threshold
    receiver: gsa-disk-usage-slack-notifications
  - match:
      alertname: fs-threshold
    receiver: disk-usage-slack-notifications
  - match:
      alertname: machine-down-in-canlab
    receiver: machine-status-slack-notifications
  - match:
      alertname: machine-down-not-in-canlab
    receiver: machine-status-slack-notifications

receivers:
- name: 'disk-usage-slack-notifications'
  slack_configs:
   - channel: '#prometheus_alerts'
     title: '{{ template "slack.mytitle.disk.text" . }}'
     title_link: 'http://foo.different.comcom:3000/dashboard/db/machine-stats-single-page-build-disk-test?var-machine={{ .GroupLabels.instance }}'
     text: '{{ template "slack.desc.disk.text" . }}'
     send_resolved: true
- name: 'gsa-disk-usage-slack-notifications'
  slack_configs:
   - channel: '#prometheus_alerts'
     title: '{{ template "slack.mytitle.gsa.text" . }}'
     title_link: 'http://foo.different.comcom:3000/dashboard/db/machine-stats-single-page-build-disk-test?var-machine={{ .GroupLabels.instance }}'
     text: '{{ template "slack.desc.gsa.text" . }}'
     send_resolved: true
- name: 'machine-status-slack-notifications'
  slack_configs:
   - channel: '#prometheus_alerts'
     title: '{{ template "slack.mytitle.text" . }}'
     title_link: 'http://foo.different.com:3000/dashboard/db/machine-stats-single-page-build-disk-test?var-machine={{ .GroupLabels.instance }}'
     text: '{{ template "slack.desc.text" . }}'
     send_resolved: true


# Inhibition rules allow to mute a set of alerts given that another alert is
# firing.
# We use this to mute any warning-level notifications if the same alert is
# already critical.
#inhibit_rules:
#- source_match:
#    severity: 'critical'
#  target_match:
#    severity: 'warning'
  # Apply inhibition if the alertname is the same.
  #  equal: ['alertname']
- Prometheus configuration file:
i# my global config
global:
  scrape_interval:     15s # Set the scrape interval to every 15 seconds. Default is every 1 minute.
  evaluation_interval: 5m # Evaluate rules every 15 seconds. The default is every 1 minute.
  # scrape_timeout is set to the global default (10s).

# Alertmanager configuration
alerting:
  alertmanagers:
  - static_configs:
    - targets:
      - localhost:9093

# Load rules once and periodically evaluate them according to the global 'evaluation_interval'.
rule_files:
  - "alerts.yml"
  # - "second_rules.yml"

# A scrape configuration containing exactly one endpoint to scrape:
# Here it's Prometheus itself.
scrape_configs:
  # The job name is added as a label `job=<job_name>` to any timeseries scraped from this config.
  #

  # metrics_path defaults to '/metrics'
  # scheme defaults to 'http'.

  - job_name: 'prometheus'
    static_configs:
      - targets: ['localhost:9090']

  - job_name: 'general'
    static_configs:
      - targets: ['lorem.ipsum.com:1337']
      - targets: ['bar.foo.bar:1337']
      - targets: ['foo.bar.com:1337']
      - targets: ['localhost:1337']
- Logs:
Alertmanager logs.

level=info ts=2018-09-07T20:22:14.013605369Z caller=main.go:174 msg="Starting Alertmanager" version="(version=0.15.2, branch=HEAD, revision=d19fae3bae451940b8470abb680cfdd59bfa7cfa)"
level=info ts=2018-09-07T20:22:14.013710082Z caller=main.go:175 build_context="(go=go1.10.3, user=root@3101e5b68a55, date=20180814-10:53:39)"
level=info ts=2018-09-07T20:22:14.047249055Z caller=cluster.go:155 component=cluster msg="setting advertise address explicitly" addr=10.31.9.74 port=9094
level=info ts=2018-09-07T20:22:14.051230665Z caller=cluster.go:570 component=cluster msg="Waiting for gossip to settle..." interval=2s
level=info ts=2018-09-07T20:22:14.051244997Z caller=main.go:322 msg="Loading configuration file" file=simple_new.yml
level=info ts=2018-09-07T20:22:14.059479976Z caller=main.go:398 msg=Listening address=:9093
level=info ts=2018-09-07T20:22:16.053277255Z caller=cluster.go:595 component=cluster msg="gossip not settled" polls=0 before=0 now=1 elapsed=2.00019006s
level=info ts=2018-09-07T20:22:24.058948881Z caller=cluster.go:587 component=cluster msg="gossip settled; proceeding" elapsed=10.005876805s
 justinjk007
All 33 comments
Can you share the alerting rules too? If anything the problem is probably with your Prometheus configuration because AlertManager relies only on what's coming from Prometheus. Setting evaluation_interval: 5m might be the issue as by default AlertManager would auto-resolve firing alerts after 5 minutes (*). Try setting it to a lower value (1m is a reasonable value).
(*) at least with your Prometheus version, this has changed recently so that Prometheus would explicitly set the end time of the alert (see https://github.com/prometheus/prometheus/pull/4550).
 simonpasquier
on 12 Sep 2018
simonpasquier
on 12 Sep 2018
Ok, sorry for the late reply, I will try that today.
justinjk007
on 17 Sep 2018
Totally forgot to get back, this solved the problem evaluation_interval: 1m helped.
justinjk007
on 28 Sep 2018
@justinjk007 thanks for following up!
simonpasquier
on 28 Sep 2018
This has been frustrating, How can a simple thing like this be broken. My configs have not changed other than the config evaluation_interval: 5m -> evaluation_interval: 1m . But the issue came back after couple of days. It is still giving out false alerts and then going back to Firing. Since you mentioned above whatever issue was fixed on the latest prometheus . I have updated both prometheus and alert-manager. But the issue is still there.
I have never mentioned my alerts config may be that's relevant too ?
groups:
    - name: test
      rules:
          - alert: fs-threshold
            expr: ceil(fs_used_p) > fs_thresh
            for: 10m
            labels:
                severity: critical
                slack: "{{ range printf `avg_over_time(notif_info{instance=\"%s\"}[10m])` $labels.instance | query }}{{.Labels.slack}}{{ end }}"
                mount: "{{ $labels.mount }}"
                used_percentage: '{{$value}}' # This is the fs_used_p value
          - alert: main_mount-fs-threshold
            expr: ceil((main_mount_used/main_mount_total)*100) > main_mount_thresh*100
            for: 10m
            labels:
                severity: critical
                email: '{{$labels.email}}'
                slack: '{{$labels.slack}}'
                used_percentage: '{{$value}}' # This is the main_mount_used/main_mount_total eval

          - alert: machine-down-in-lab
            expr: avg_over_time(up{instance=~".*lab.*"}[15m]) < 0.5
            for: 10m
            labels:
                severity: critical
                slack: "{{ range printf `avg_over_time(notif_info{instance=\"%s\"}[10m])` $labels.instance | query }}{{.Labels.slack}}{{ end }}"
            annotations:
                summary: "Machine went down please fix {{$labels.instance}}"
          - alert: machine-down-not-in-lab
            expr: avg_over_time(up{instance!~".*lab.*"}[20m]) < 0.2
            for: 10m
            labels:
                severity: critical
                slack: "{{ range printf `avg_over_time(notif_info{instance=\"%s\"}[10m])` $labels.instance | query }}{{.Labels.slack}}{{ end }}"
            annotations:
                summary: "Machine went down please fix {{$labels.instance}}"
It is still giving out false alerts and then going back to Firing.
I don't get it. Can you give more details about what's going on?
I see that the slack label values in the alerts use a Prometheus query. If the value of this label changes over time then it would explain why you get flapping alerts as the identify of an alert is defined by its label names/values.
simonpasquier
on 16 Oct 2018
The problem is still the same old problem
I only use alert manager(for now) to monitor if machine is down/up and if any disk locations I monitor goes above threshold . At first I only had disk usage being alerted. At which point, I was getting notifications all the time during the day, my disk space issue is resolved , but then couple of minutes later, it became firing again. I thought this is because the usage was very close to the threshold level. And it might have resolved for some time. But then I started monitoring machine up/down status as well, I started getting alerts saying machines being down resolved. But these are machines that does not even have the prometheus exporter running. So they were never up/resolved.
I will experiment with slack query today to see if that helps
justinjk007
on 16 Oct 2018
@simonpasquier Those slack query slack: "{{ range printfavg_over_time(notif_info{instance=\"%s\"}[10m])$labels.instance | query }}{{.Labels.slack}}{{ end }}" ends up being the slack handle of the person who is being pinged. This never changes on the custom exporter data. So I don't think its that.
justinjk007
on 16 Oct 2018
hmm, if your node is down for more than 10m then that query will return nothing?
simonpasquier
on 16 Oct 2018
yep
justinjk007
on 16 Oct 2018
I have updated that to 20 mins to see if that fixes anything. I haven't gotten a false alert since, but I will just wait for couple of days before I can confirm if that was the problem,
justinjk007
on 16 Oct 2018
I have updated that to 20 mins to see if that fixes anything
Didn't help
justinjk007
on 17 Oct 2018
I have updated that to 20 mins to see if that fixes anything
Didn't help
Just an idea. Try checking time on all of your cluster nodes. I have a suspicion that not having NTP installed may be causing similar behaviour for me.
KUBE01 | SUCCESS | rc=0 >>
16:56:21 up 6 days, 5:31, 1 user, load average: 0.31, 0.35, 0.46
KUBE02 | SUCCESS | rc=0 >>
16:55:20 up 21 days, 4:51, 1 user, load average: 0.67, 0.84, 1.32
KUBE03 | SUCCESS | rc=0 >>
16:57:37 up 80 days, 23:52, 1 user, load average: 0.69, 0.45, 0.41
 P6rguVyrst
on 22 Oct 2018
P6rguVyrst
on 22 Oct 2018
Check the time and then what ? I gotta make the time exactly the same on every machine ?
justinjk007
on 22 Oct 2018
This has turned into support rather than a feature request/bug report, it would be best if this was continued on the mailing list [email protected] to reach a wider audience that may have similar issues.
 stuartnelson3
on 22 Oct 2018
stuartnelson3
on 22 Oct 2018
Check the time and then what ? I gotta make the time exactly the same on every machine ?
Yes, that's what NTP is for.
You could get by by deploying prometheus-server and alertmanager on same node, but that's a dirty solution.
If time is the issue here, then I think this issue can be closed?
P6rguVyrst
on 25 Oct 2018
Check your prometheus rule evaluation duration. If it's too long then you may have gaps in your metrics which can cause flapping. Even if rule eval duration isn't the cause, you should definitely check your alert queries using a "graphed" prom query with low resolution so you can see any gaps in your metrics. This will also help you determine if there are many timeseries instead of the expected one because of label changes.
 tmegow
on 13 Jan 2019
tmegow
on 13 Jan 2019
I'm having this issue too. I have an alert based on the probe_ssl_earliest_cert_expiry metric from the blackbox exporter. It is supposed to let us know when an ssl certificate is within 30 days of expiring.
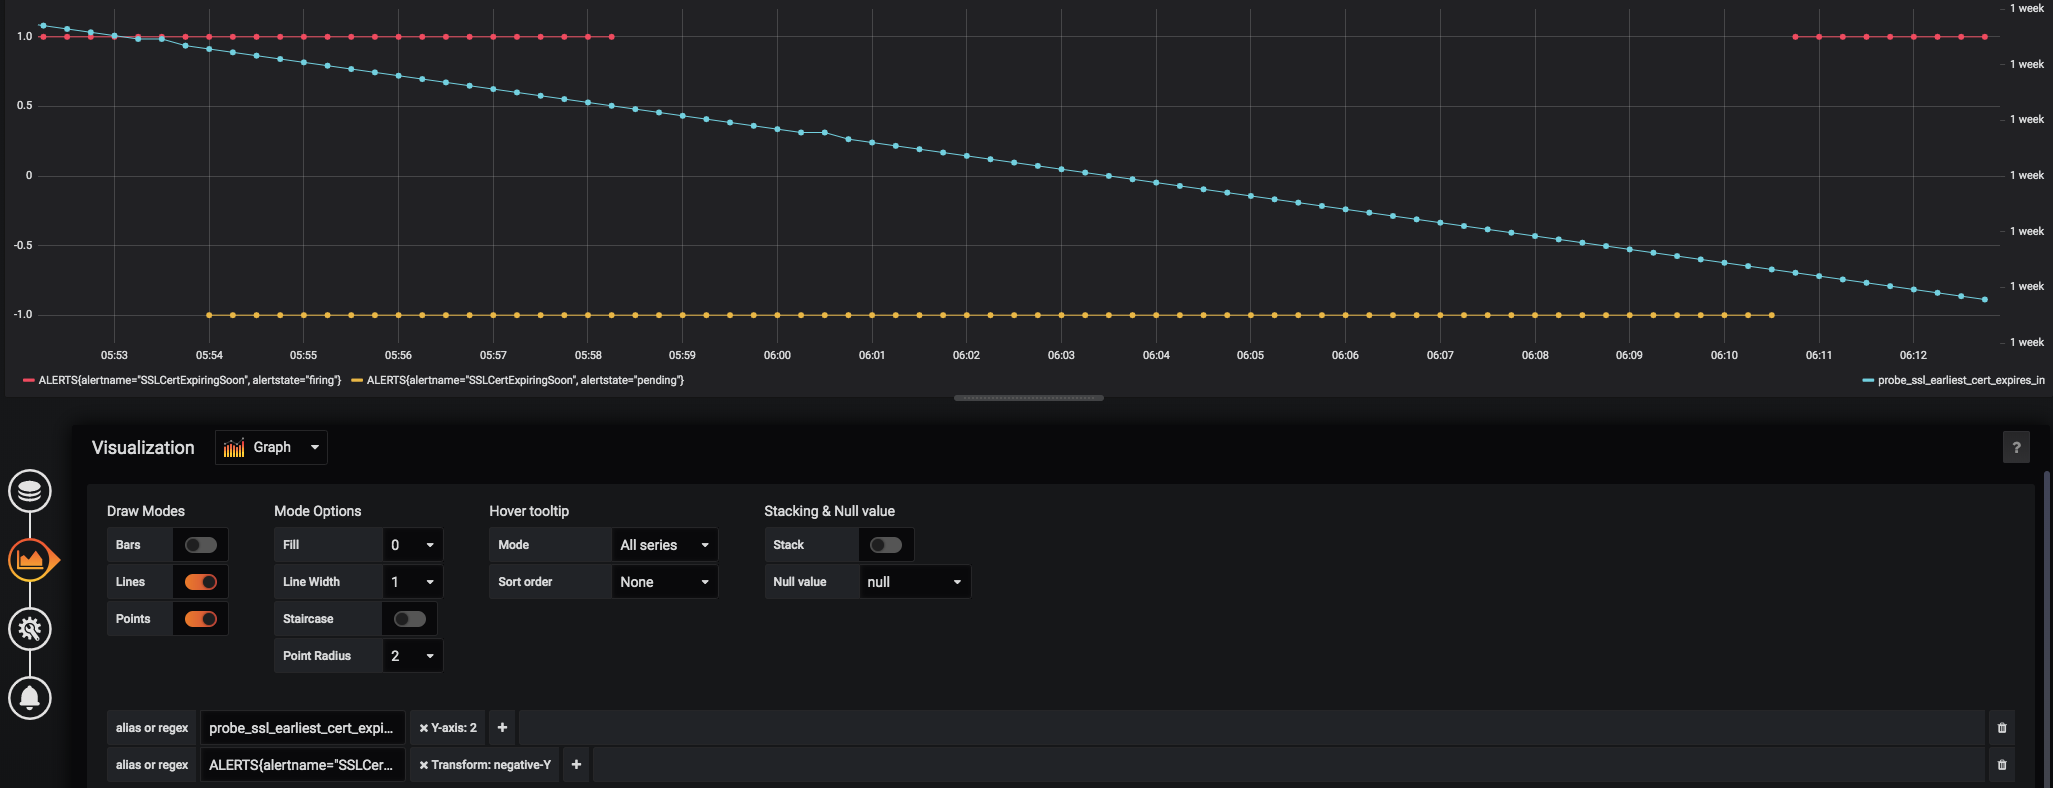
The above grafana graph shows the alert going from:
- Firing
- Both firing and pending
- Just pending (triggering a resolve)
- Firing again (triggering a notification).
I don't understand how the same alert can be both pending and firing, nor why the alert would resolve while there is a value within the alert threshold. AlertManager and Prometheus aren't guaranteed to be on the same computer, but they are using ntp so the clocks should be very close to each other. The alert originally was based on the raw blackbox exporter metric and time() ( probe_ssl_earliest_cert_expiry{job="blackbox"} - time() < 86400 * 30 ), but I thought maybe the math and magic time() timeseries might be causing evaluation issues, so I created a recording rule and changed the alert to be based off the recorded metric and that didn't fix it.
The relevant portions of our prometheus configuration
prometheus.yml
global:
  scrape_interval:     15s # By default, scrape targets every 15 seconds.
  evaluation_interval: 15s # By default, scrape targets every 15 seconds.

rule_files:
  - "/etc/prometheus/rules.d/*.rules"

scrape_configs:
  - job_name: 'blackbox'
    scrape_interval: 15s
    metrics_path: /probe
    params:
      module: [http_2xx]
    static_configs:
      - targets:
        - URL_REDACTED
rules.d/recording.rules:
  - name: ssl_cert_expiration_calculations
    rules:
    - record: instance:probe_ssl_earliest_cert_expiry:delta
      expr: probe_ssl_earliest_cert_expiry{job="blackbox"} - time()
rules.d/platform.rules:
```
groups:
- name: Platform
rules:
- alert: SSLCertExpiringSoon
expr: instance:probe_ssl_earliest_cert_expiry:delta < 86400 * 30
for: 10m
labels:
alert_slack_channel: "platform-alerts"
annotations:
summary: "[[ deploy_env ]]: {{ $labels.instance }} has an SSL cert expiring soon."
description: "[[ deploy_env ]]: {{ $labels.instance }} has an SSL cert expiring within 30 days."
- alert: SSLCertExpiringSoon
 cconstantine
on 28 Jun 2019
cconstantine
on 28 Jun 2019
I've updated the alert expr to be min_over_time(instance:probe_ssl_earliest_cert_expiry:delta[10m]) < 86400 * 30 and moved alertmanager to the same machine as prometheus and I'm still getting the above alert behavior.
cconstantine
on 2 Jul 2019
@cconstantine commenting on an old issue isn't the most efficient way. Please send a message with all details to our user mailing list. I'll follow up there.
simonpasquier
on 3 Jul 2019
I've replied here because the issue is still open, and I believe this is a bug in prometheus/alertmanager.
I'll send a message to the mailing list, but if this behavior isn't considered a bug, could this issue be closed?
cconstantine
on 3 Jul 2019
+1
 wang1219
on 29 Aug 2019
wang1219
on 29 Aug 2019
I suddenly started seeing the same problem in our setup and get flooded with Firing-Resolve-Firing-... notifications for some periods of time, even though the metrics on the Prometheus server are not changing over that timeframe.
In our case the rhythm of the notifications is one every 5 minutes (e.g. a cycle of Firing-Resolve takes 10 minutes). When looking at Alertmanager, the start time of the alert remains static, the end time is set and cleared though, like that:
04:11 UTC: Firing Start 04:10 UTC, End none
04:16 UTC: Resolve Start 04:10 UTC, End 04:15 UTC
04:21 UTC: Firing Start 04:10 UTC, End none
04:25 UTC: Resolve Start 04:10 UTC, End 04:25 UTC
For this specific flooding occurrence, it stopped after a last (correct) firing message:
09:51 UTC: Resolve Start 04:10 UTC, End 09:51 UTC
09:56 UTC: Firing Start 04:10 UTC, End none
This has happened with different alerts so far so it does not seem to be tied to a specific alert. Also, I have not observed this until recently and so far only with V0.20.0 (but we skipped some versions). Unfortunately I don't have logs right now but I could try to produce some if required.
The setup is pretty simple; one server with both Prometheus and Alertmanager (not clustered), therefore this should not be related to time issues. Also the fact that the alert start time does not shift points more towards a problem in the notifications part.
Config (without global, receivers and templates):
route:
  receiver: 2FEV8TB5
  group_by:
  - alertname
  - host
  group_wait: 30s
  group_interval: 5m
  repeat_interval: 3h
Version information:
Revision: f74be0400a6243d10bb53812d6fa408ad71ff32d
Version: 0.20.0
 avonwyss
on 7 May 2020
avonwyss
on 7 May 2020
@avonwyss the 5 minutes interval comes from group_interval. I suspect that it is Prometheus generating firing/resolved alerts. One way to troubleshoot is to look at the ALERTS timeseries at the time when the problem happens.
simonpasquier
on 13 May 2020
@simonpasquier Thank you for the hint, I'll have a look the next time it occurs. However, if it was Prometheus, shouldn't the start time be reset? This made me think it was in the Alertmanager.
avonwyss
on 13 May 2020
I'm having the issue too...
 dsmith73
on 31 May 2020
dsmith73
on 31 May 2020
I'm having the issue too...
There can be multiple reasons for this. If you have evidence that this is actually the same issue, then I suggest providing some more information (e.g. details of the ALERTS series, your configs). Otherwise I suggest posting to the mailing list to work out the details and see if there is some configuration issue (such as a bad HA configuration, dynamically changing labels or flapping expressions).
 hoffie
on 1 Jun 2020
hoffie
on 1 Jun 2020
@hoffie - certainly. I setup deadmanswitch to test it
Here's the output in Slack -
prometheusAPP 22:54
ERROR : Prometheus AlertManager E2E dead man switch (instance )
Prometheus DeadManSwitch is an always-firing alert. It's used as an end-to-end test of Prometheus through the Alertmanager.
VALUE = 1
LABELS: map[]
Details:
• alertname: PrometheusAlertmanagerE2eDeadManSwitchprometheusAPP 22:53
ERROR : Prometheus AlertManager E2E dead man switch (instance )
Prometheus DeadManSwitch is an always-firing alert. It's used as an end-to-end test of Prometheus through the Alertmanager.
VALUE = 1
LABELS: map[]
Details:
• alertname: PrometheusAlertmanagerE2eDeadManSwitchprometheusAPP 22:48
RESOLVED : Prometheus AlertManager E2E dead man switch (instance )
Prometheus DeadManSwitch is an always-firing alert. It's used as an end-to-end test of Prometheus through the Alertmanager.
VALUE = 1
LABELS: map[]
Details:
• alertname: PrometheusAlertmanagerE2eDeadManSwitchprometheusAPP 22:31
ERROR : Prometheus AlertManager E2E dead man switch (instance )
Prometheus DeadManSwitch is an always-firing alert. It's used as an end-to-end test of Prometheus through the Alertmanager.
VALUE = 1
LABELS: map[]
Details:
• alertname: PrometheusAlertmanagerE2eDeadManSwitch
Here's the alertmanager config -
route:
  receiver: 'THE-notify'
  group_by: ['instance', 'alertname', 'product', 'cluster']
  group_wait: 30s
  group_interval: 1m
  repeat_interval: 3h


  routes:
  - match_re:
      service: (?i)(ssl-expire|service-down|prometheus)\S+
    receiver: THE-notify
    group_by: [instance, alertname, cluster, product]
    routes:
    - match:
        severity: error
      receiver: THE-pager
    - match:
        severity: critical
      receiver: THE-pager
I believe it's coming in over the fallback route, since it doesn't match anything else.
Here's the prometheus alert rule -
      - alert: PrometheusAlertmanagerE2eDeadManSwitch
        expr: vector(1)
        for: 5m
        labels:
          severity: error
        annotations:
          summary: "Prometheus AlertManager E2E dead man switch (instance {{ $labels.instance }})"
          description: "Prometheus DeadManSwitch is an always-firing alert. It's used as an end-to-end test of Prometheus through the Alertmanager.\n  VALUE = {{ $value }}\n  LABELS: {{ $labels }}"
What other information would you like?
I'm nearly positive that this is a mis-configuration on my part (semi-new to prometheus), but I cannot find it for the life of me.
dsmith73
on 5 Jun 2020
I have multiple areas where this appears to be happening, but I figured the best way to test it was to setup an alert that would always fire, and then see if I received notifications more often than every 3hrs, or if I received any Resolved messages... I did (shown above)
dsmith73
on 5 Jun 2020
Had the same problem with alerts firing and resolving constantly and seemingly randomly. It turned out that one of the Prometheus instances' system clock was not synchronized properly. Once the NTP was setup correctly, things started making sense again :smile:
 nirgilboa
on 10 Jun 2020
nirgilboa
on 10 Jun 2020
@nirgilboa You experienced a different issue. In the setups where all is on the same machine (Prometheus and Alertmanager) there cannot be a time issue, and the rhythm of the firing/resolve is not random when the issue occurs. So yes time needs to be in sync for alerts to be reliable, but there is still a bug around which causes these incorrect resolve and re-alert to happen.
avonwyss
on 11 Jun 2020
I'm experiencing the exact same thing using blackbox. How is this still an issue?
 shadow9911
on 21 Jul 2020
shadow9911
on 21 Jul 2020
I'm experiencing the exact same thing using blackbox. How is this still an issue?
I suspect two things:
- This Github issue's title describes a symptom which can be caused by lots of things. Unsynchronized time in clustered setups, staleness due to too long scrape or evaluation times (>2m), changes in alert labels, etc.
- Lots of people seem to be running Prometheus/Alertmanager without this issue, therefore, most people would not know how to reproduce/fix this.
@shadow9911 and anybody else still seeing this issue: Can you post to the prometheus-users mailing list and provide the following information?
- Prometheus version
- Alertmanager version
- The result of the Prometheus query
ALERTS[1h](maybe limited to thealertname=you are looking at) - Alertmanager logs (debug level, if possible)
- A description of alertmanager behavior (e.g. example firing/resolve messages)
- Prometheus config, including the relevant alert rules and scrape configs
- Alertmanager config
The best thing would be if someone managed to come up with some self-contained example which demonstrated the issue. I understand that this is often not possible, sadly.
hoffie
on 18 Oct 2020
Related issues
 pborzenkov
·
5Comments
pborzenkov
·
5Comments
 leonerd
·
6Comments
leonerd
·
6Comments
 FirstEncounter
·
4Comments
stuartnelson3
·
5Comments
FirstEncounter
·
4Comments
stuartnelson3
·
5Comments
 marcan
·
4Comments
marcan
·
4Comments
Most helpful comment
Had the same problem with alerts firing and resolving constantly and seemingly randomly. It turned out that one of the Prometheus instances' system clock was not synchronized properly. Once the NTP was setup correctly, things started making sense again :smile: