Hello,
today I successfully tested the first JavaScript based control add-in with AL on Dynamics 365.
The implementation of my existing add-ins works without any problems - GOOD WORK!! :)
But is there a possibility to debug the control add-in directly in VS Code?
If I try to set a breakpoint inside my js files there appears a warning message "file is not part of the current workspace".
It is possible to debug the control add-in js files in VS Code?
At the moment, I only can debug in browsers.
Thank you!
question
 PeterSchade1306
>All comments
This is already possible using VSCode chrome debugger.
- Install Chrome debugger extension
- Make sure Chrome has remote debugging enabled.
- In
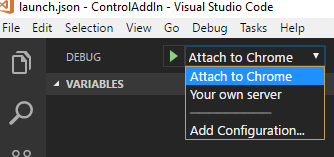
launch.json, add a new configuration for attaching to Chrome:
{
  "type": "chrome",
  "request": "attach",
  "name": "Attach to Chrome",
  "port": 9222,
  "webRoot": "${workspaceRoot}"
}
- Click F5 to start AL debugger.
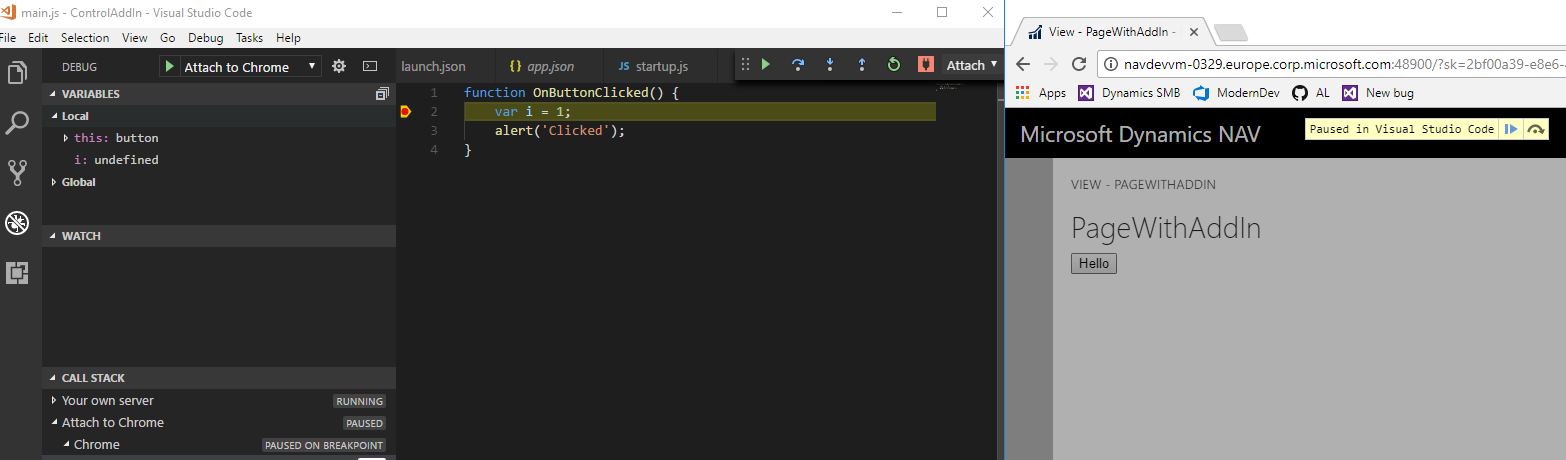
- In VSCode Debug panel, choose "Attach to chrome" and run it as well. At this point we are running two debuggers - AL debugger connected to the server and Chrome debugger connected to the browser.
- Hit some JavaScript code. I think it could be a bit problematic to debug StartupScript, since it is embedded directly in HTML code. I couldn't do it from the first try, but maybe Chrome debugger can be configured to debug JS inside HTML as well. Other scripts work fine though.
See attached sample project.
ControlAddIn.zip
JS breakpoint when clicking a button in the control add-in:
 dennisfrostlander
on 23 Oct 2017
dennisfrostlander
on 23 Oct 2017
👍2
Was this page helpful?
0 / 5 - 0 ratings
Related issues
 bvbeek
·
3Comments
bvbeek
·
3Comments
 RedFoxUA
·
3Comments
RedFoxUA
·
3Comments
 ghost
·
3Comments
ghost
·
3Comments
 TinaMenezes
·
3Comments
TinaMenezes
·
3Comments
 kine
·
3Comments
kine
·
3Comments
Most helpful comment
This is already possible using VSCode chrome debugger.
launch.json, add a new configuration for attaching to Chrome:See attached sample project.
ControlAddIn.zip
JS breakpoint when clicking a button in the control add-in:
