Agents.jl: `node_weights` (alias `nodeweights`) doesn't seem to work properly
g = model.space.graph

weight_matrix = LightGraphs.weights(g)
for i in 1:nv(g)
    weight_matrix[i,i] = 0
end

edgewidthsdict = Dict()
for node in 1:nv(g)
    nbs = neighbors(g,node)
    for nb in nbs
        edgewidthsdict[(node,nb)] = weight_matrix[node,nb] / sum([outneighbor for outneighbor in weight_matrix[node,:]])
    end
end

edgewidthsf(s,d,w) = edgewidthsdict[(s,d)]*5

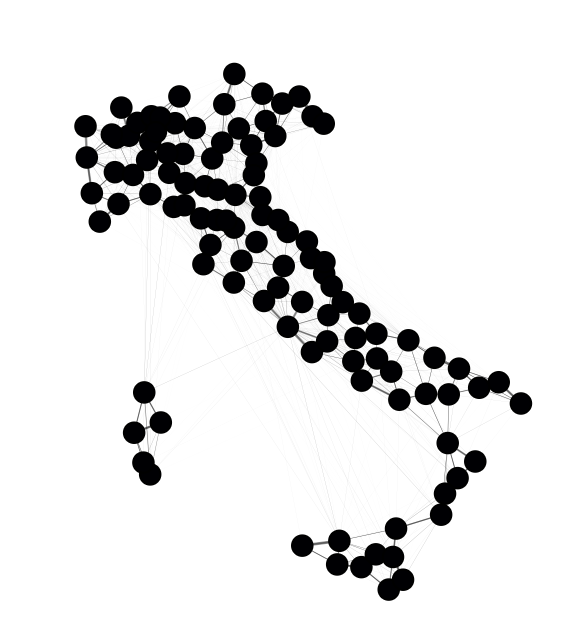
plotargs = (x=d.x, y=d.y , nodeshape=:circle, nodesize=15, nodeweights=vcat(10^6,fill(0,106)), linealpha=0.4,
            aspect_ratio = 1, size = (1000, 1000), showaxis = false)

plotargs = merge(plotargs, (edgewidth = edgewidthsf,))

plotabm(model; ac=exposed_fraction, plotargs...)
 pitmonticone
All 8 comments
The graph plot recipe (that we use under the hood) change recently. This breakage probably comes from there.
 Datseris
on 12 Sep 2020
Datseris
on 12 Sep 2020
The graph plot recipe (that we use under the hood) change recently. This breakage probably comes from there.
I see, thanks.
Do you think there might be some way to get around it?
pitmonticone
on 12 Sep 2020
One would have to check our source code here https://github.com/JuliaDynamics/AgentsPlots.jl/blob/master/src/graph.jl and just make sure that it works with the latest GraphPlots recipe https://github.com/JuliaGraphs/GraphPlot.jl . Feel free to do a PR about it (unlikely to be fixed by the devs, because Agents.jl will switch to Makie once Makie is stable)
Datseris
on 12 Sep 2020
Tracking upstream: JuliaPlots/GraphRecipes.jl#134
 Libbum
on 13 Sep 2020
Libbum
on 13 Sep 2020
Is it possible for you to give an example that runs? On my machine I get the following:
using Agents, Random, DataFrames, LightGraphs
using Distributions: Poisson, DiscreteNonParametric
using DrWatson: @dict
using Plots

mutable struct PoorSoul <: AbstractAgent
    id::Int
    pos::Int
    days_infected::Int  # number of days since is infected
    status::Symbol  # 1: S, 2: I, 3:R
end

function model_initiation(;
    Ns,
    migration_rates,
    β_und,
    β_det,
    infection_period = 30,
    reinfection_probability = 0.05,
    detection_time = 14,
    death_rate = 0.02,
    Is = [zeros(Int, length(Ns) - 1)..., 1],
    seed = 0,
)

    Random.seed!(seed)
    @assert length(Ns) ==
    length(Is) ==
    length(β_und) ==
    length(β_det) ==
    size(migration_rates, 1) "length of Ns, Is, and B, and number of rows/columns in migration_rates should be the same "
    @assert size(migration_rates, 1) == size(migration_rates, 2) "migration_rates rates should be a square matrix"

    C = length(Ns)
    # normalize migration_rates
    migration_rates_sum = sum(migration_rates, dims = 2)
    for c in 1:C
        migration_rates[c, :] ./= migration_rates_sum[c]
    end

    properties = @dict(
        Ns,
        Is,
        β_und,
        β_det,
        β_det,
        migration_rates,
        infection_period,
        infection_period,
        reinfection_probability,
        detection_time,
        C,
        death_rate
    )
    space = GraphSpace(complete_digraph(C))
    model = ABM(PoorSoul, space; properties = properties)

    # Add initial individuals
    for city in 1:C, n in 1:Ns[city]
        ind = add_agent!(city, model, 0, :S) # Susceptible
    end
    # add infected individuals
    for city in 1:C
        inds = get_node_contents(city, model)
        for n in 1:Is[city]
            agent = model[inds[n]]
            agent.status = :I # Infected
            agent.days_infected = 1
        end
    end
    return model
end

using LinearAlgebra: diagind

function create_params(;
    C,
    max_travel_rate,
    infection_period = 30,
    reinfection_probability = 0.05,
    detection_time = 14,
    death_rate = 0.02,
    Is = [zeros(Int, C - 1)..., 1],
    seed = 19,
)

    Random.seed!(seed)
    Ns = rand(50:5000, C)
    β_und = rand(0.3:0.02:0.6, C)
    β_det = β_und ./ 10

    Random.seed!(seed)
    migration_rates = zeros(C, C)
    for c in 1:C
        for c2 in 1:C
            migration_rates[c, c2] = (Ns[c] + Ns[c2]) / Ns[c]
        end
    end
    maxM = maximum(migration_rates)
    migration_rates = (migration_rates .* max_travel_rate) ./ maxM
    migration_rates[diagind(migration_rates)] .= 1.0

    params = @dict(
        Ns,
        β_und,
        β_det,
        migration_rates,
        infection_period,
        reinfection_probability,
        detection_time,
        death_rate,
        Is
    )

    return params
end

params = create_params(C = 8, max_travel_rate = 0.01)
model = model_initiation(; params...)

using AgentsPlots

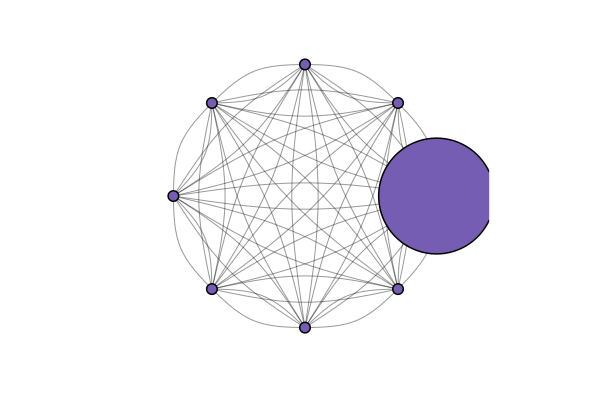
plotargs = (node_size = 0.2, method = :circular, linealpha = 0.4, nodeweights = [10;zeros(length(nodes(model))-1)])

plotabm(model; plotargs...)
 JackDevine
on 15 Sep 2020
JackDevine
on 15 Sep 2020
@pitmonticone: the example by @JackDevine may have uncovered something perhaps undocumented here. Notice that Jack has used a weight of 10 for the highlighted node, thus a display ratio of 10:1 to all the other nodes.
Your example on the other hand has a 1000000:1 ratio, and I doubt that makes any sense for displaying your information.
Could you try altering nodeweights=vcat(10^6,fill(0,106) to nodeweights=vcat(10,fill(0,106) and see if you still get undefined behaviour?
Libbum
on 15 Sep 2020
That is a good point, well spotted. The other difference is that the OP uses nodesize=15.
Although for me it still works with nodeweights=[10^6;ones(length(nodes(model))-1)]), so I am not sure what is going on.
JackDevine
on 17 Sep 2020
I suspect this issue is out of scope for this repo anyhow, but since we have (for the moment) deprecated the graph plotter completely—this is something we wont investigate further.
Libbum
on 26 Mar 2021
Related issues
 fbanning
·
10Comments
fbanning
·
10Comments
 flipgthb
·
5Comments
Datseris
·
13Comments
flipgthb
·
5Comments
Datseris
·
13Comments
 hbsmith
·
13Comments
Datseris
·
9Comments
hbsmith
·
13Comments
Datseris
·
9Comments
Most helpful comment
Is it possible for you to give an example that runs? On my machine I get the following: