Activitywatch: cant access data
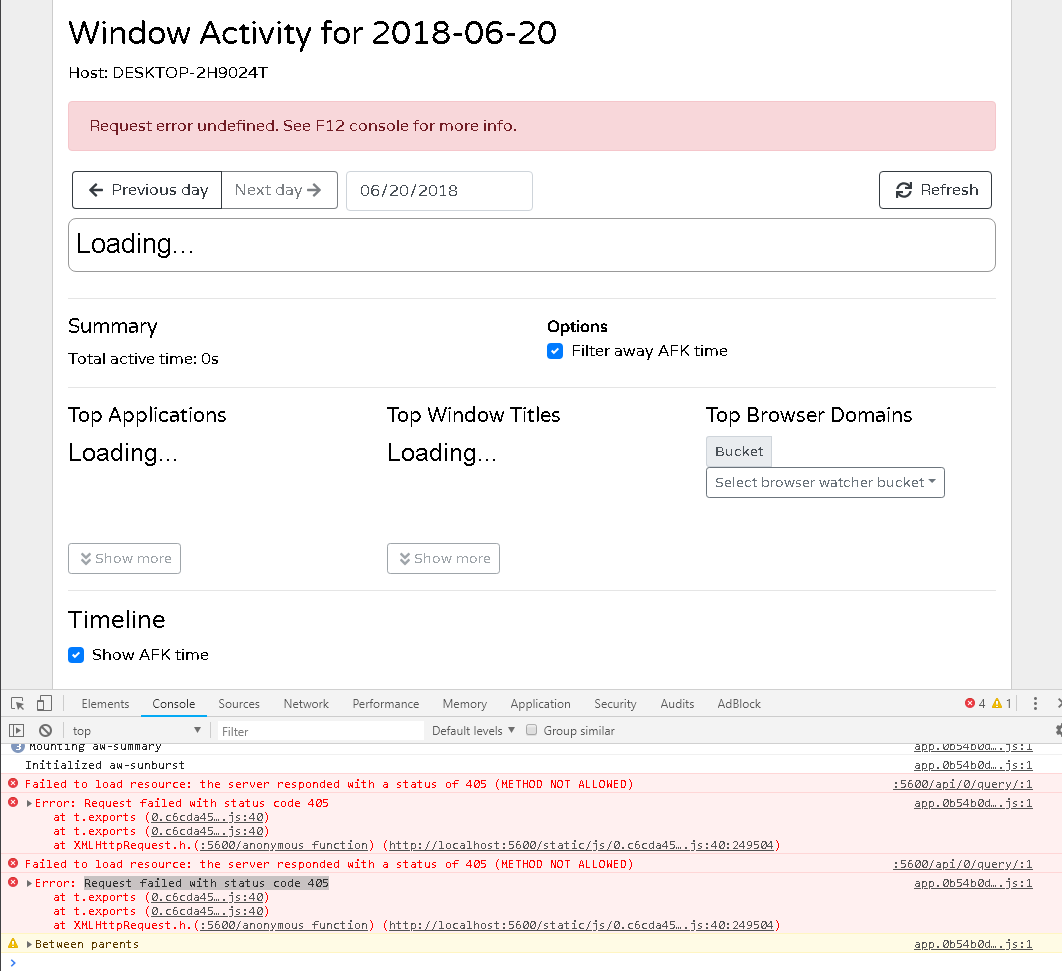
whats going on? this is release Version 0.7.1
server says:
2018-06-20 05:16:39 [INFO ]: 405 (127.0.0.1): POST /api/0/query/ HTTP/1.1 (flask:25)
2018-06-20 05:16:39 [INFO ]: 405 (127.0.0.1): POST /api/0/query/ HTTP/1.1 (flask:25)
2018-06-20 05:17:05 [INFO ]: 404 (127.0.0.1): GET /static/js/0.c6cda4549578f441ef7b.js.map HTTP/1.1 (flask:25)
2018-06-20 05:17:05 [INFO ]: 404 (127.0.0.1): GET /static/js/app.0b54b0d4570611bb544f.js.map HTTP/1.1 (flask:25)
2018-06-20 05:17:05 [INFO ]: 404 (127.0.0.1): GET /0.css.map HTTP/1.1 (flask:25)
2018-06-20 05:17:05 [INFO ]: 404 (127.0.0.1): GET /app.css.map HTTP/1.1 (flask:25)
 ghost
ghost
All 15 comments
That's weird, never seen that before. Have you tried v0.8.0b3?
 ErikBjare
on 20 Jun 2018
ErikBjare
on 20 Jun 2018
yes, v0.8.0b3 wont work at all.
v0.8.0b3 throws afk watcher exit error and nothing starts.
v0.7.1 starts and I can see clock chart only.
ghost
on 20 Jun 2018
v0.7.1 starts and I can see clock chart only.
The clock chart is the only visualizer which does not use the query API so the issue must be specific to that.
 johan-bjareholt
on 20 Jun 2018
johan-bjareholt
on 20 Jun 2018
could you please tell me how can I troubleshoot this issue?
ghost
on 20 Jun 2018
You could manually test if the query api works at http://localhost:5600/api/ (query api is at 0/query/)
Here are some links which could help you if you need sample data as arguments (sadly can't help you more with this at the moment):
https://github.com/ActivityWatch/aw-webui/blob/master/src/views/Activity.vue#L448
https://github.com/ActivityWatch/aw-webui/blob/master/src/queries.js#L69
Does this also lead to a 405 status?
 Otto-AA
on 20 Jun 2018
Otto-AA
on 20 Jun 2018
I didnt build from source :(
will try on another PC in a week or so
ghost
on 20 Jun 2018
I didnt build from source :(
(If this was in response to my testing suggestions...)
You don't need to build from source to go to the api page. The link should be at the bottom of the dashboard.
Otto-AA
on 20 Jun 2018
So go to 127.0.0.1:5600/api/, then press on the /0/query tab, press "try it out" and enter this
{
  "query": [
    "afk_events = query_bucket(find_bucket('aw-watcher-afk_'));",
    "RETURN = afk_events;"
  ],
  "timeperiods": [
    "2018-06-15/2018-06-25"
  ]
}
Once that is done, see what the response is and post it here.
johan-bjareholt
on 20 Jun 2018
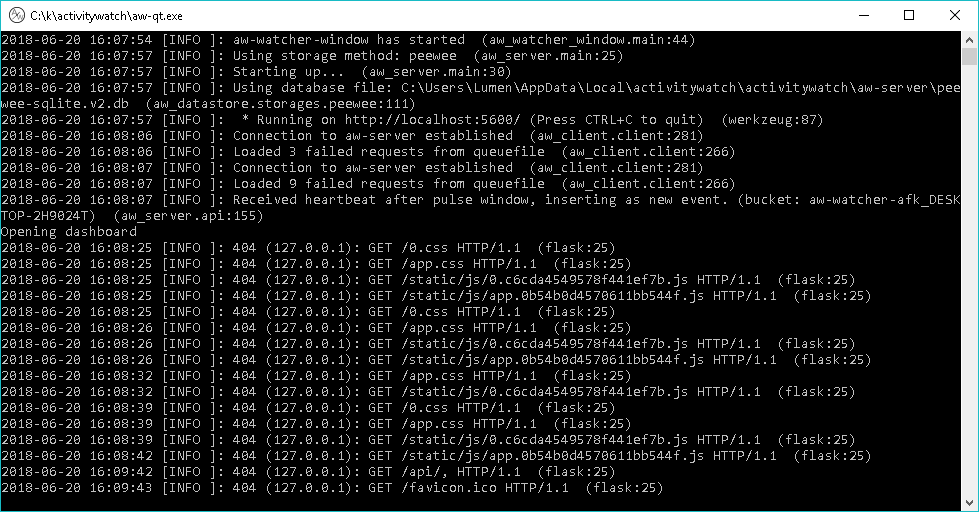
looks like I cant access it now at all :)
ghost
on 20 Jun 2018
That doesn't make sense in the last picture, you must've removed the html/css/js files by mistake or something. They used to rely in aw_server/static inside your activitywatch folder.
johan-bjareholt
on 20 Jun 2018
This makes no sense. Unless someone else reports the same issue or reproduces it I'm closing this.
ErikBjare
on 22 Aug 2018
I have the same problem in win 7 . instead of opening the localhost link it download it in firefox . chrome same : it print in chrome this:
<!DOCTYPE html><html><head><meta charset=utf-8><title>ActivityWatch</title><link rel=icon type=image/png href=/static/logo.png><link href=/0.css rel=stylesheet></head><body><div id=app></div><script type=text/javascript src=/static/js/0.eb46a9d79636be6aeb56.js></script><script type=text/javascript src=/static/js/app.a7d0c96a632897a88302.js></script></body></html>
the api page open fine,but the test 0/query/ gave :
Error: INTERNAL SERVER ERROR
Response body
{
  "message": "Internal Server Error"
}

Response headers
 content-length: 37
 content-type: application/json
 date: Mon, 29 Oct 2018 05:39:30 GMT
 server: Werkzeug/0.14.1 Python/3.5.3
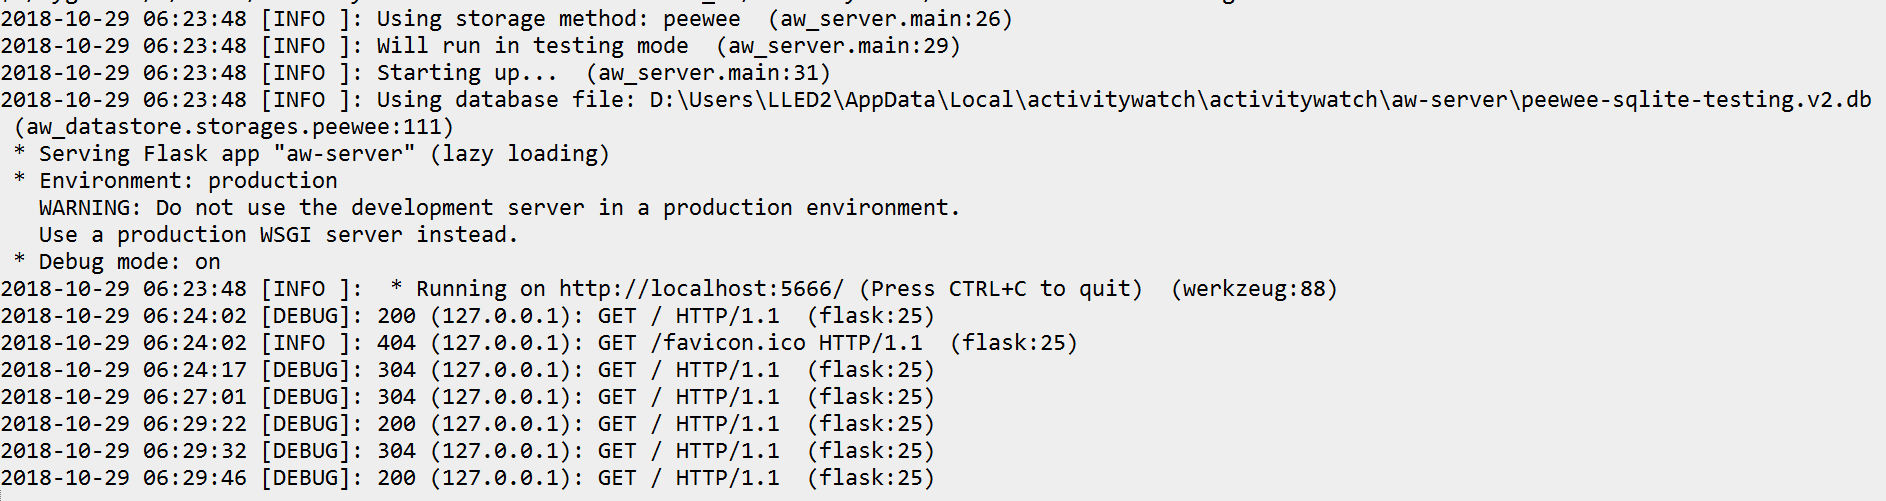
the server says that:
 alkorsan
on 29 Oct 2018
alkorsan
on 29 Oct 2018
@alkorsan Your aw-server log doesn't show anything regarding an error (only requests to /, never /api/0/query/), we can't debug without that log.
johan-bjareholt
on 29 Oct 2018
is there anything I have to post please? where can I find the needed logs for debug? I m new to this beautifull software. thank you
alkorsan
on 29 Oct 2018
It is the correct log, but for some reason the query request is not showing up in the log.
My guess on why it doesn't show up is because I can see that you are running aw-server in testing mode but you are likely doing the query request to another non-testing server. The non-testing aw-server runs at 127.0.0.1:5600 while the testing server runs at 127.0.0.1:5666, you need to make sure that you are doing the request to the 5666 port since that's the only place where you have log output.
johan-bjareholt
on 29 Oct 2018
Related issues
 TheOrigins
·
6Comments
TheOrigins
·
6Comments
 iamsoorena
·
10Comments
iamsoorena
·
10Comments
 bawasi
·
8Comments
bawasi
·
8Comments
 xylix
·
6Comments
xylix
·
6Comments
 mrbox
·
5Comments
mrbox
·
5Comments