Actions-runner-controller: Jobs suddenly loses connection on AKS
Hi, I deploy to runner on AKS with helm and working with dind custom image.
apiVersion: actions.summerwind.dev/v1alpha1
kind: RunnerDeployment
metadata:
  name: deploy-runner
spec:
  replicas: 1
  template:
    spec:
      image: ****.azurecr.io/runner-dind
      repository: ****
      dockerdWithinRunnerContainer: true
      env: []
      volumeMounts:
      - mountPath: /runner
        name: runner
      volumes:
      - name: runner
        hostPath:
          path: /runner
      serviceAccountName: runner
And here is the dockerfile
FROM summerwind/actions-runner-dind

USER root
RUN curl -LO https://dl.k8s.io/release/v1.20.0/bin/linux/amd64/kubectl && chmod +x kubectl && cp kubectl /usr/local/bin/kubectl
RUN curl https://raw.githubusercontent.com/helm/helm/master/scripts/get-helm-3 | bash
RUN wget https://github.com/roboll/helmfile/releases/download/v0.138.7/helmfile_linux_amd64 -O /usr/local/bin/helmfile
RUN chmod +x /usr/local/bin/helmfile
USER 1000
When I run job, suddenly connection lost. Always in the same time connection lost.
Here is the screenshot.
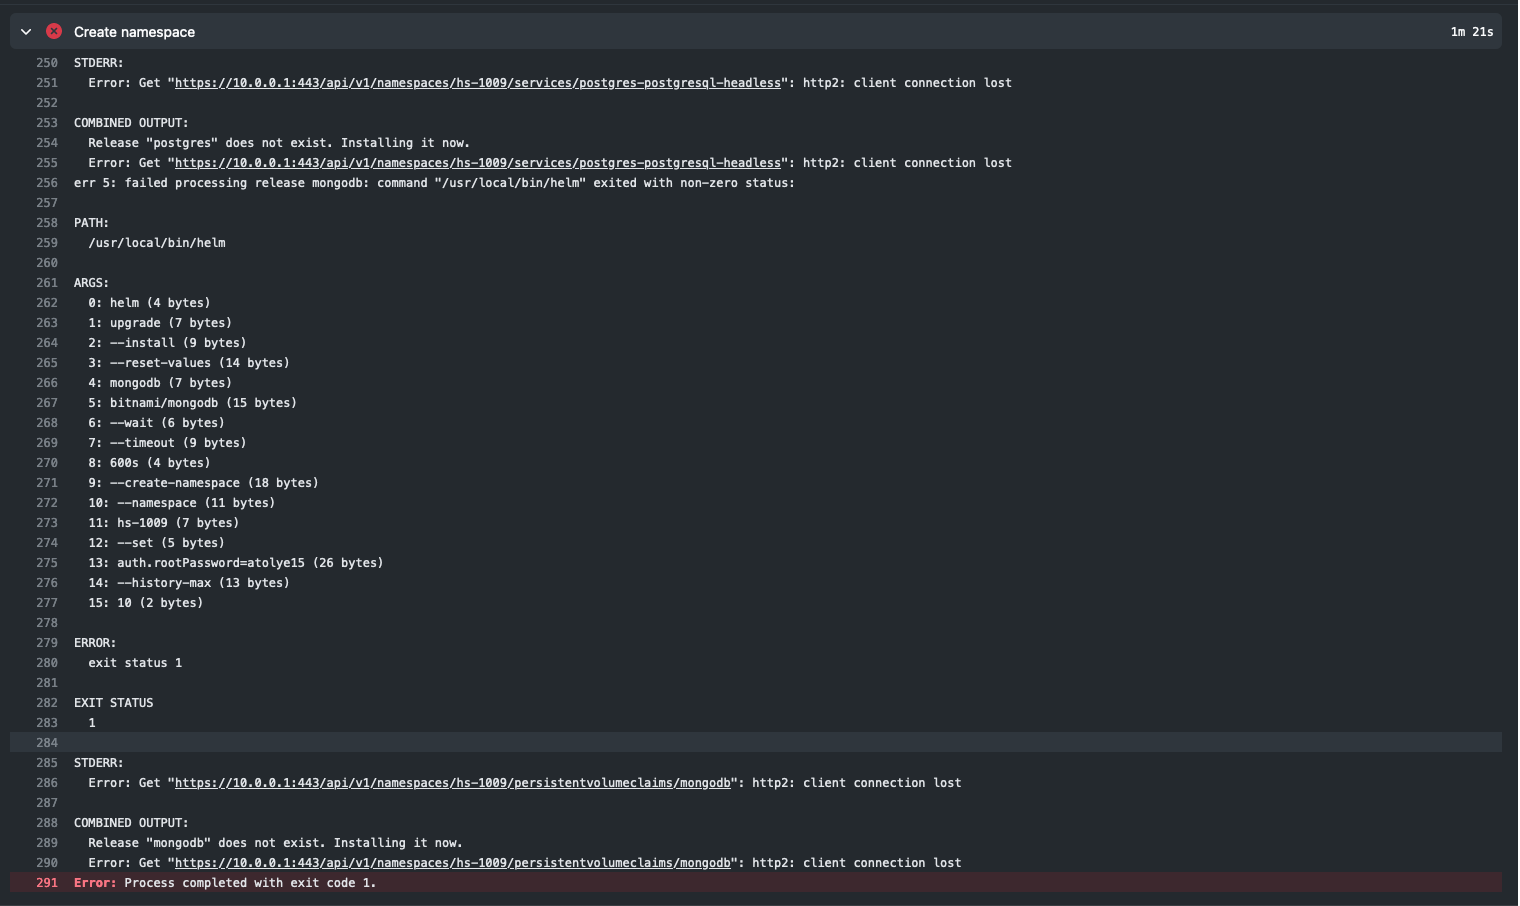
and Runner log:
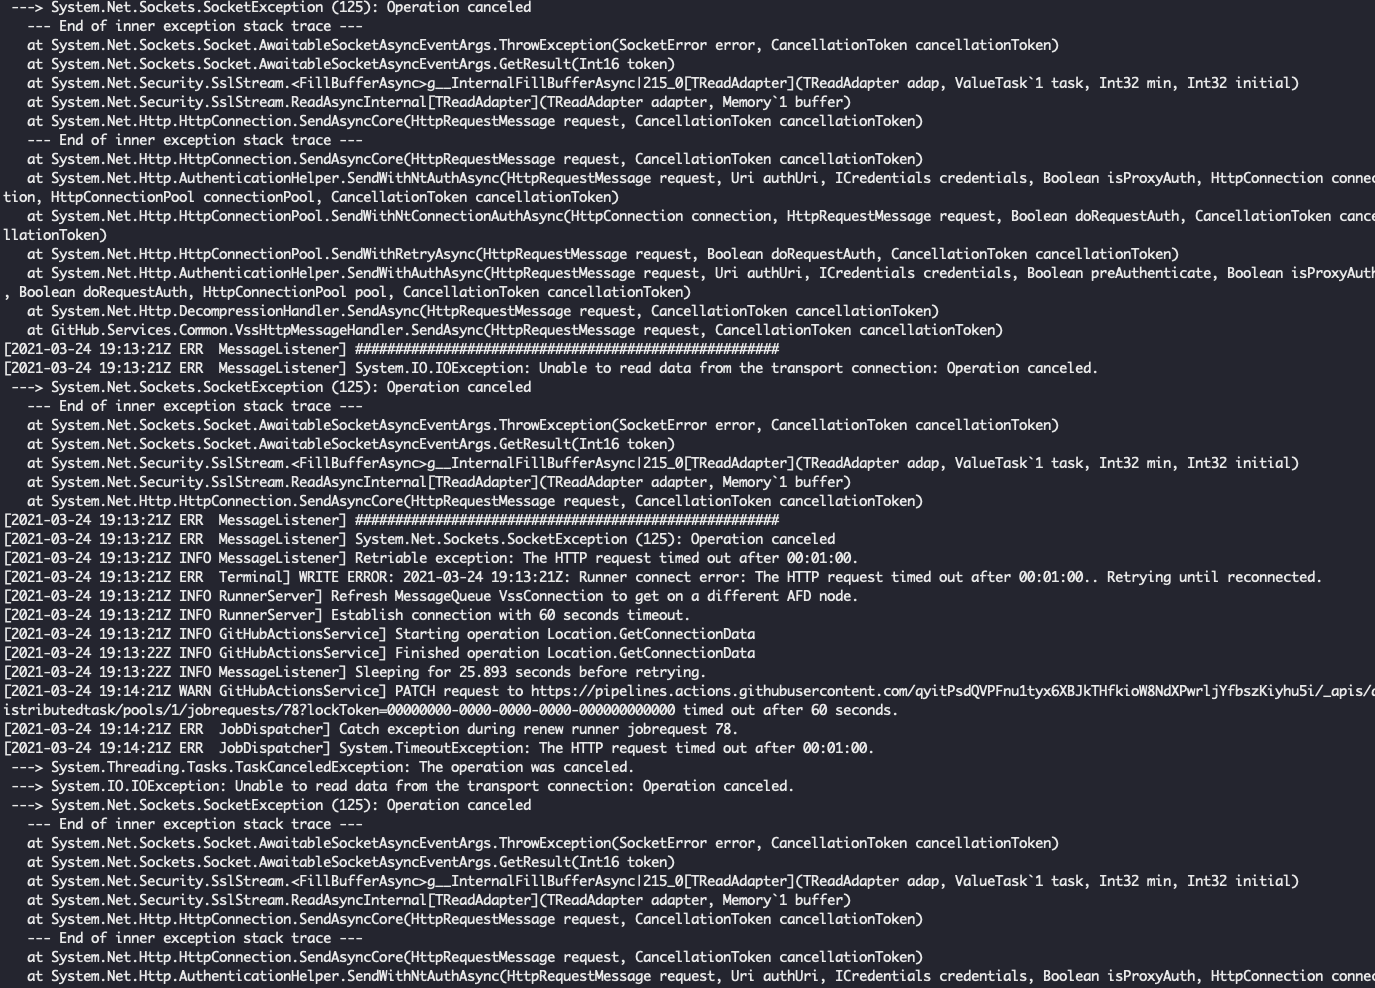
and worker log:
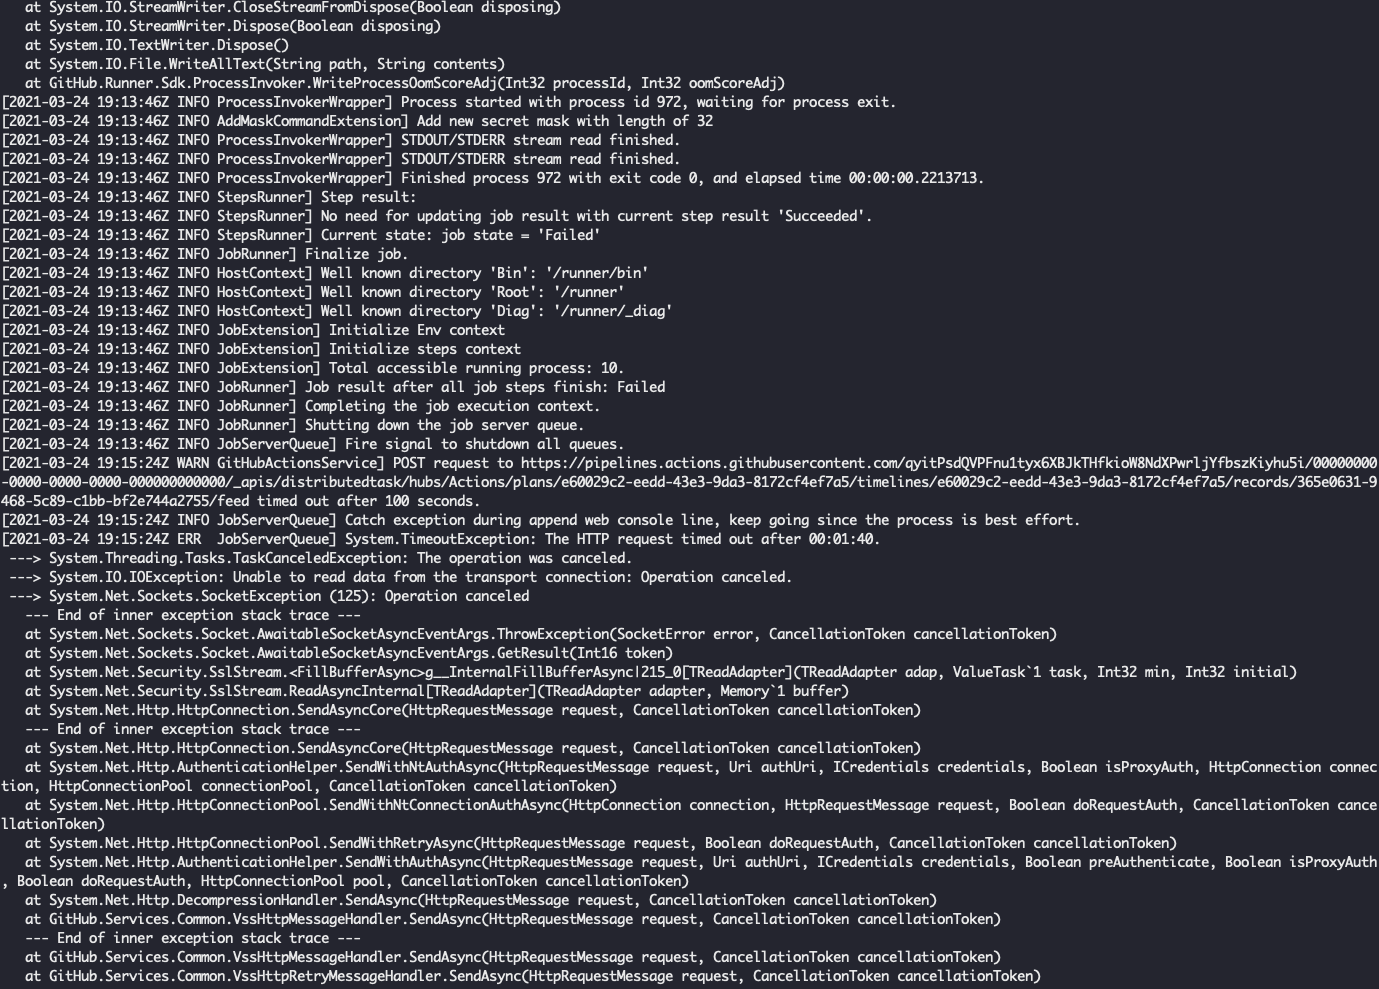
 onuryartasi
All 17 comments
@onuryartasi Hey! What's interesting to me here is that even your connection to K8s API server(10.0.0.1:443) is being affected.
Do you have any custom CNI networking daemonset in your cluster? For AWS/EKS I thought it's aws-node daemonset but I'm not experienced in AKS. If you have one, investigating logs of such daemonset or anything you think related may help.
 mumoshu
on 24 Mar 2021
mumoshu
on 24 Mar 2021
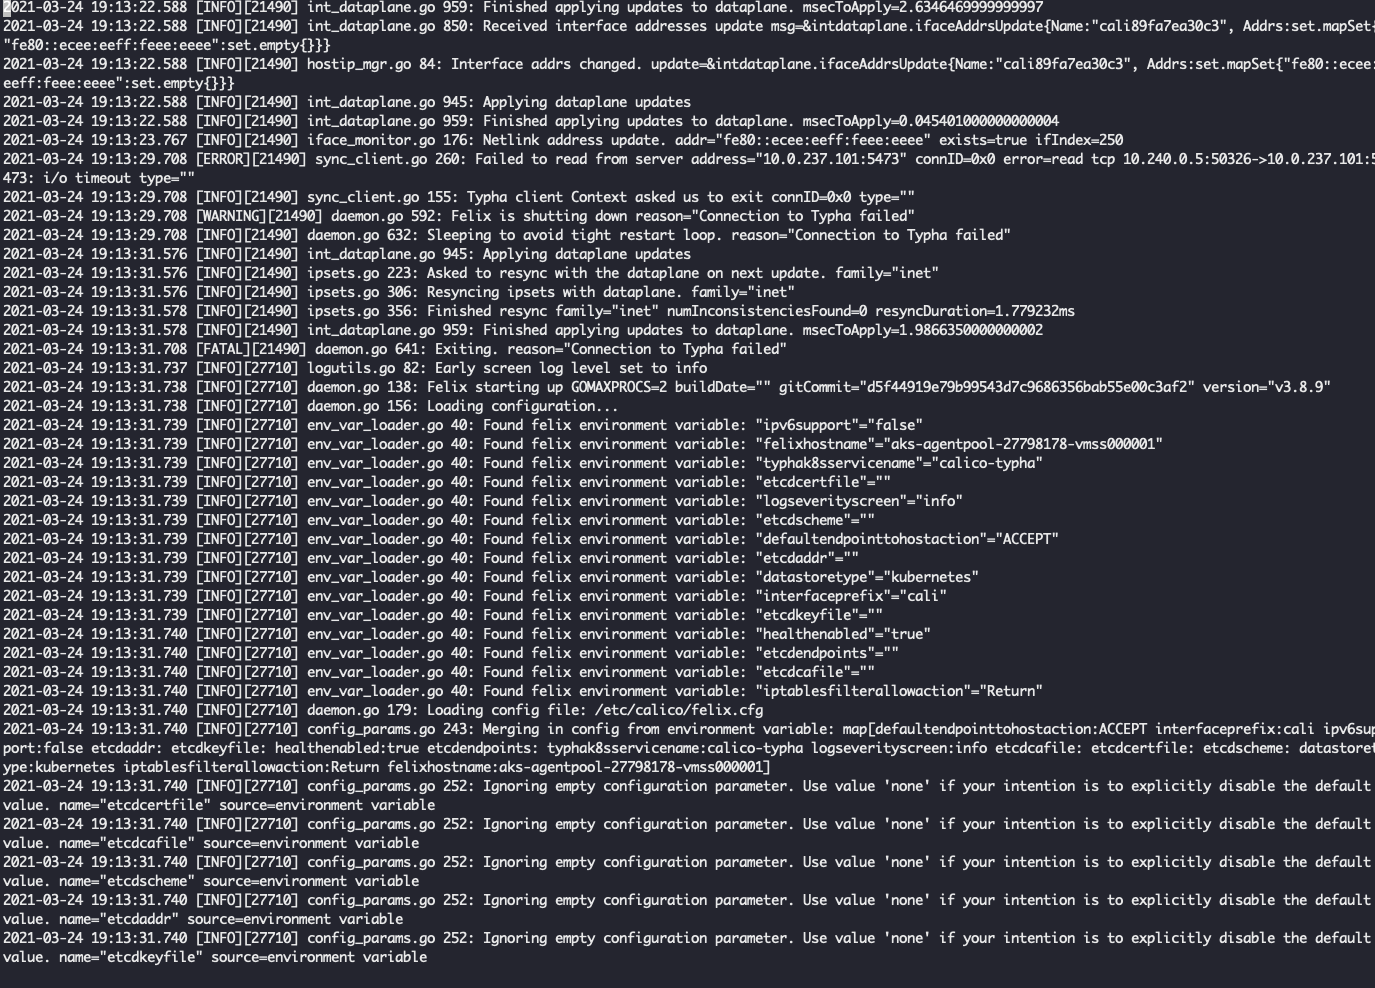
Hi @mumoshu ,I'am using calico for cni. I saw intresting log in calico.And log's time matched to previous screenshot.
here is the logs:
onuryartasi
on 24 Mar 2021
@onuryartasi Thanks! That "Received interface addresses update ..." error and the context looks very similar to https://github.com/projectcalico/calico/issues/1658. What version of Calico are you using? Are you using in-cluster etcd that is part of your Calico setup for Felix? Do you have any idea why the interface address changed?(On AKS/Azure does the network interface gets removed/added automatically/on-demand without your intervention..?
mumoshu
on 24 Mar 2021
Actually kubernetes is maintain by azure. I haven't access to master server, kube-api and etcd.
Calico comes with aks. And version is calico/node:v3.8.9.2. Probably problem is aks. Other jobs successfully done. I have success jobs lasting times 10 minutes.
I dont have idea why change the interface adress.
And here is the kube-dns logs. But just got error with watch event.
default kubernetes 20.76.22.95:443
kube-system kube-dns 10.244.0.53:53
W0324 20:44:03.024064       1 reflector.go:302] pkg/mod/k8s.io/[email protected]/tools/cache/reflector.go:98: watch of *v1.Namespace ended with: an error on the server ("unable to decode an event from the watch stream: read tcp 10.244.0.53:56372->20.76.22.95:443: read: connection timed out") has prevented the request from succeeding
W0324 20:44:03.024064       1 reflector.go:302] pkg/mod/k8s.io/[email protected]/tools/cache/reflector.go:98: watch of *v1.Namespace ended with: an error on the server ("unable to decode an event from the watch stream: read tcp 10.244.0.53:56372->20.76.22.95:443: read: connection timed out") has prevented the request from succeeding
W0324 20:44:03.024071       1 reflector.go:302] pkg/mod/k8s.io/[email protected]/tools/cache/reflector.go:98: watch of *v1.Service ended with: an error on the server ("unable to decode an event from the watch stream: read tcp 10.244.0.53:56372->20.76.22.95:443: read: connection timed out") has prevented the request from succeeding
W0324 20:44:03.024071       1 reflector.go:302] pkg/mod/k8s.io/[email protected]/tools/cache/reflector.go:98: watch of *v1.Service ended with: an error on the server ("unable to decode an event from the watch stream: read tcp 10.244.0.53:56372->20.76.22.95:443: read: connection timed out") has prevented the request from succeeding
W0324 20:44:03.024115       1 reflector.go:302] pkg/mod/k8s.io/[email protected]/tools/cache/reflector.go:98: watch of *v1.Endpoints ended with: an error on the server ("unable to decode an event from the watch stream: read tcp 10.244.0.53:56372->20.76.22.95:443: read: connection timed out") has prevented the request from succeeding
W0324 20:44:03.024115       1 reflector.go:302] pkg/mod/k8s.io/[email protected]/tools/cache/reflector.go:98: watch of *v1.Endpoints ended with: an error on the server ("unable to decode an event from the watch stream: read tcp 10.244.0.53:56372->20.76.22.95:443: read: connection timed out") has prevented the request from succeeding
@onuryartasi Thanks for clarifying! Gotcha. I'm sorry but I have no other idea than suggesting you to ask Azure support(there's something like that in Azure, too?) for help investigating it as a general pod networking issue.
mumoshu
on 24 Mar 2021
@mumoshu , actually I started manually this step in runner container and work very well. Today I will write simple runner and try with this runner.
onuryartasi
on 25 Mar 2021
@onuryartasi How did your test go?
I was surveying AKS issues and came up to this: https://github.com/Azure/AKS/issues/642#issuecomment-551101797
Is there a component name "tunnel front" in AKS? If so, would restarting it fixes the instability...?
mumoshu
on 29 Mar 2021
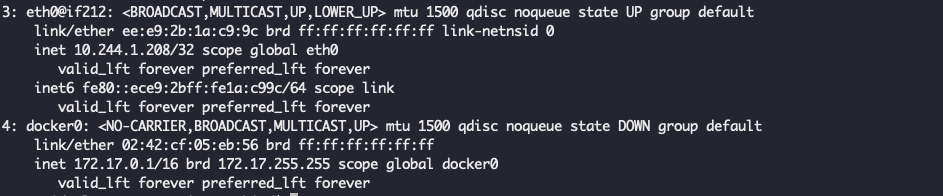
@onuryartasi Could you confirm this isn't an issue related to MTU? #393 Probably not, but I thought I've seen similar errors there.
mumoshu
on 29 Mar 2021
Hi @mumoshu, I am very busy these days therefore I removed wait parameter in helmfile and I used kubectl wait --for command instead of wait parameter. I don't see any error in tunnel-front container but docker0 interface's MTU 1500.
onuryartasi
on 30 Mar 2021
therefore I removed wait parameter in helmfile and I used kubectl wait --for command instead of wait parameter.
@onuryartasi Thanks! Did using kubectl wait resolved your issue?
mumoshu
on 30 Mar 2021
therefore I removed wait parameter in helmfile and I used kubectl wait --for command instead of wait parameter.
@onuryartasi Thanks! Did using
kubectl waitresolved your issue?
Yes, kubectl wait --for resolved my issue.
onuryartasi
on 30 Mar 2021
@onuryartasi Thanks for the info. That's super interesting!
Now I'm wondering if your node had been in short of memory due to helmfile using too much memory running multiple concurrent helm processes with --wait.
helmfile by default runs up to N helm processes concurrently, where N matches to the number of releases in your helmfile.yaml. If that was the issue, I guess running helmfile with helmfile apply --concurrency 1 would probably resolve the issue even when you waited with helmfile.
mumoshu
on 30 Mar 2021
@onuryartasi Thanks for the info. That's super interesting!
Now I'm wondering if your node had been in short of memory due to helmfile using too much memory running multiple concurrent helm processes with
--wait.
helmfileby default runs up to N helm processes concurrently, where N matches to the number of releases in your helmfile.yaml. If that was the issue, I guess runninghelmfilewithhelmfile apply --concurrency 1would probably resolve the issue even when youwaited with helmfile.
I am suspect the kubernetes master resource too. Today I will try concurrency 1 and I let you know.
onuryartasi
on 30 Mar 2021
@onuryartasi Thanks 🙏
To protect system components from failing due to excessive resource consumption by app pods, I'd also suggest setting resource requests/limits to the same amount(no overcommit) in your RunnerDeployment spec:
apiVersion: actions.summerwind.dev/v1alpha1
kind: RunnerDeployment
metadata:
  name: deploy-runner
spec:
  replicas: 2
  template:
    spec:
      enterprise: your-enterprise-name
      dockerdWithinRunnerContainer: true
      resources:
        limits:
          cpu: "1000m"
          memory: "1Gi"
        requests:
          cpu: "1000m"
          memory: "1Gi"
# snip
This way, OOM won't result in killing system components fast which may end up hard-to-debug issues like this. Instead the runner pod would fail with a more visible error (like OOM)
mumoshu
on 30 Mar 2021
Hi @mumoshu, I tried --concurrency 1 parameter and resolved this issue fyi.
onuryartasi
on 30 Mar 2021
@onuryartasi Thanks a lot for the info! I've seen many kinds of errors due to resource shortage so far. Now I got to think if we'd better have a very low default resource.requeests/limits so that the error can be more intuitive, at least. WDYT?
mumoshu
on 30 Mar 2021
@mumoshu, Actually I think the cause of this issue insufficient resource of master nodes. Maybe decrease default concurrent number.
onuryartasi
on 30 Mar 2021
Related issues
 rofafor
·
4Comments
rofafor
·
4Comments
 kimxogus
·
3Comments
kimxogus
·
3Comments
 sripberger
·
4Comments
sripberger
·
4Comments
 vitobotta
·
7Comments
vitobotta
·
7Comments
 kaykhancheckpoint
·
4Comments
kaykhancheckpoint
·
4Comments