Environment
- Elixir version (elixir -v): 1.6.5
- Absinthe version (mix deps | grep absinthe): 1.4.12
- Client Framework and version (Relay, Apollo, etc): Apollo from GraphiQL
The problem
In project I work on there is a query with 4-level nested fields. One of 3-level fields is a large list of small entities (~8500 elements).
Absinthe processes this query in ~750 ms on my local machine. Half of this time is spent on two database queries (via Dataloader) and JSON encoding and the second half is spent in walk_result fn from Absinthe.Phase.Document.Resolution and run fn from Absinthe.Pipeline (latter seems to spend about 100 ms only to quit from recursion).
In our stage environment Absinthe processes this exact query in 3000-6000 ms but both db queries take rough 300 ms.
Do you have any insights how can we speed up such queries? Or maybe you could investigate Absinthe implementation?
If you need more info please tell me.
 0nkery
All 43 comments
Hey! This is almost certianly a duplicate of https://github.com/absinthe-graphql/absinthe/issues/569 for which a fix was just pushed onto the v1.4 branch. I hope to have a new version cut this morning. Are you able to try the v1.4 branch?
 benwilson512
on 6 Jul 2018
benwilson512
on 6 Jul 2018
Hi, thanks for reply! Yes, I'll check it.
0nkery
on 6 Jul 2018
Sadly, I am not able to tell the difference.
0nkery
on 6 Jul 2018
That is definitely unfortunate. Can you show what you put in your mix config?
Performance issues are difficult to assess without a working example, if you're able to come up with a stand alone one I can look at it further.
benwilson512
on 6 Jul 2018
Ah when you said "In project I work on there is a query with 4-level nested fields. " I was reading that as inputs, which would be affected significantly by the new 1.4 commits. However you probably mean { nested { like { this } } } which would be affected only a little bit.
Do you have any middleware applied via def middleware in your schema?
benwilson512
on 6 Jul 2018
I put this in mix.exs:
{:absinthe, git: "https://github.com/absinthe-graphql/absinthe", branch: "v1.4", override: true}
Yeah that seems right, if the issue isn't about inputs the v1.4 would only make ~30% difference at most. I'd also consider trying to run on OTP 21 if you can, the improvements to map sharing should help too.
We can try to rule out some obvious things that would slow things down. Normally I'd expect the resolution phase to add about twice as much overhead as JSON encoding, it has a lot of work to do what with walking the whole result tree and pruning out the bits the query actually asked for. Several seconds though is not great, that seems to indicate an issue.
benwilson512
on 6 Jul 2018
you probably mean { nested { like { this } } }
Yes, I meant exactly that.
Do you have any middleware applied via def middleware in your schema?
Yes, we have two custom middleware functions which process incoming (whitespaces) and outgoing (errors) queries a bit.
consider trying to run on OTP 21
I did tests using OTP 21. :)
0nkery
on 6 Jul 2018
Ah, can you show your def middleware clause?
benwilson512
on 6 Jul 2018
Here it is:
def middleware(middleware, _field, %{identifier: identifier})
when identifier in [:query, :subscription, :mutation] do
[WhitespaceCleaner] ++ middleware ++ [HandleErrors]
end
def middleware(middleware, _field, _object), do: middleware
BTW, I tried to turn it off and it doesn't change anything.
0nkery
on 6 Jul 2018
Hm, well there goes my theory, those are properly scoped.
Without a concrete example I'm not entirely sure what more I can do. How large is the result JSON? Your description of the performance on your computer doesn't sound too far off, I'm not entirely sure what's up with staging.
benwilson512
on 6 Jul 2018
query PrimaryTableAssets($cursorAfter: String) {
listAssets(cursorAfter: $cursorAfter) {
cursorAfter
items {
...PrimaryTableAssetItem
__typename
}
__typename
}
}
fragment PrimaryTableAssetItem on Asset {
historicalData {
...PrimaryTableHistoricalData
__typename
}
__typename
}
fragment PrimaryTableHistoricalData on HistoricalData {
periodStart
priceClose
volumeTraded
__typename
}
Here is quite simplified version of a query. I tried to de-fragment query (to no avail), remove __typenames (:)) etc. There's ~50 items and each item holds 169 historicalData entries.
0nkery
on 6 Jul 2018
I tried to decrease items count - response time decreased almost linear - and decrease historicalData entries count - almost no difference spotted.
0nkery
on 6 Jul 2018
Yeah I'd expect a linear decrease. Just to make sure we're on the same page, by a concrete example example I mean something I can run and profile. Nothing here looks obviously wrong, so if there is progress possible here it'll require a more hands on analysis.
benwilson512
on 6 Jul 2018
Okay, I'll try to build an example.
0nkery
on 6 Jul 2018
@0nkery are you already using Jason? This is supposed to be a little faster, maybe even more so in your case.
 jeroenvisser101
on 29 Jul 2018
jeroenvisser101
on 29 Jul 2018
I'm not sure how much is it related to this issue, but I'm also noticing something that troubles me — this a snapshot of a request that fetches about a thousand elements:
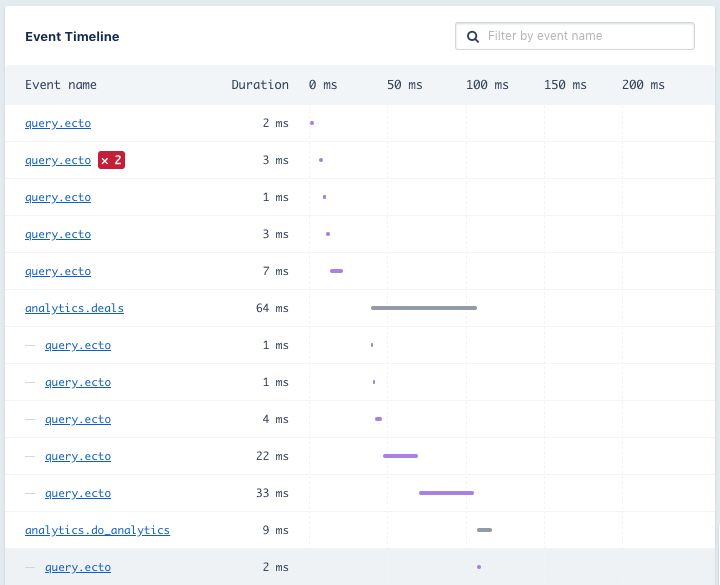
Our business logic finishes in around ~150ms and then there's a big gap until the end of the request that's outside our instrumentation. The query gets 2 resources at the same time, one of which is the big one, but none have more than 2-level nested fields.
With bigger payloads, the request increases linearly to 600-700ms.
Would you expect to see this kind of gap due to Absinthe processing the result?
Absinthe 1.4.13 / Elixir 1.6.6 / OTP 21 / Jason 1.1.1 as encoder
 svileng
on 6 Aug 2018
svileng
on 6 Aug 2018
@svileng It's possible, but as I said with @0nkery my hands a bit tied without anything concrete to work with.
The point about having all this un-instrumented time is a good one though, and there are maybe things we can look at doing to handle that. Scalar serialization for example happens after the resolution phase, so that may be worth looking at.
benwilson512
on 6 Aug 2018
I could relate that issue, when dealing with lots of items, how many fields i select slower it gets, i mean:
cities (input: $input) {
id
state {
id
}
}
resolves and respond in 77ms, meanwhile:
cities (input: $input) {
id
name
state {
id
}
}
bounces between 90ms and 110ms, but it gets worse:
cities (input: $input) {
id
name
zipcode
state {
id
name
}
}
bounces between 120ms and 140ms.
I'm using Dataloader aside Ecto. Besides, Ecto resolves the main query cities in <10ms, and the subsequent state with <1ms. That's why i'm wondering that it's something inside Absinthe, maybe something arround key selector or serialization, because when encoding the same data directly with Jason i get <0.2ms.
 schleumer
on 8 Oct 2018
schleumer
on 8 Oct 2018
Hey @schleumer I need version numbers of Dataloader and Absinthe.
benwilson512
on 8 Oct 2018
dataloader ~> 1.0.4
absinthe ~> 1.4.13
absinthe_plug ~> 1.4.5
phoenix ~> 1.3.4
ecto ~> 2.2.11
I got a full workweek, maybe on weekend i could elaborate an working example.
schleumer
on 9 Oct 2018
hey @schleumer those versions look good, a working example may be useful. Total response time will depend on
1) How many rows are you serializing?
2) How are you measuring response time? From the server? from the client?
benwilson512
on 9 Oct 2018
Around 1k rows, measuring ecto's transaction time and phoenix response time on server-side. I've attached an real world JSON dump and schema snippet until i got some working example.
My schema looks like:
object :state do
field :id, non_null(:string)
field :name, non_null(:string)
field :abbreviation, non_null(:string), resolve: fn a, b, c ->
{:ok, a.id}
end
field :range1_start, :string
field :range1_end, :string
field :range2_start, :string
field :range2_end, :string
end
object :city do
field :id, non_null(:integer)
field :state_id, non_null(:string)
field :name, non_null(:string)
field :zipcode, :string
field :state, :state, resolve: dataloader(:repo, :state)
end
I'm stuck with the same problem. Yesterday I took some time to debug it.
First, both the apollo engine and Appsignal give me the same information, almost the same showed by @svileng in this comment. I'm using Dataloader, so it isn't an N+1 query problem.
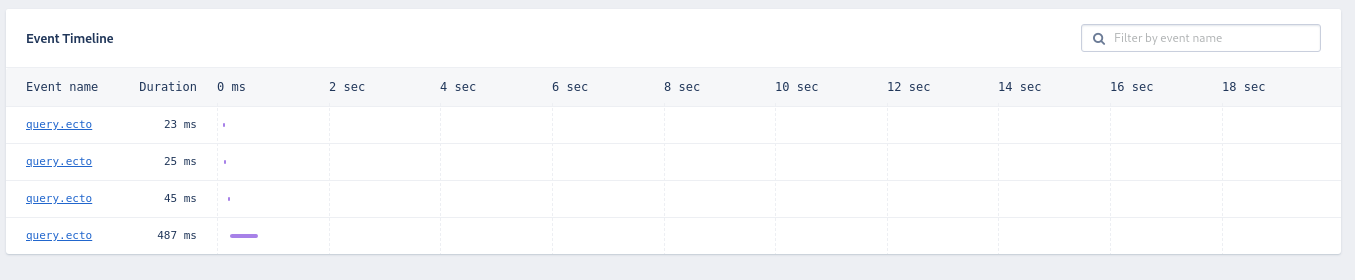
We have a simple query with a lot of results (between 2k and 3k), the query is something very near people have pointed here.
level_1 {
    property_1
    assoc_1 {
        property_2
        property_3
    }
}
This query is really slow ~ 21 seconds if I remove nested fields it goes to something between 7~10 seconds. Not the main point here, but we also have some weird memory peaks, those aren't frequent (neither is the problematic query). Our logging shows the peaks only appearing when this query with a lot of results is called.
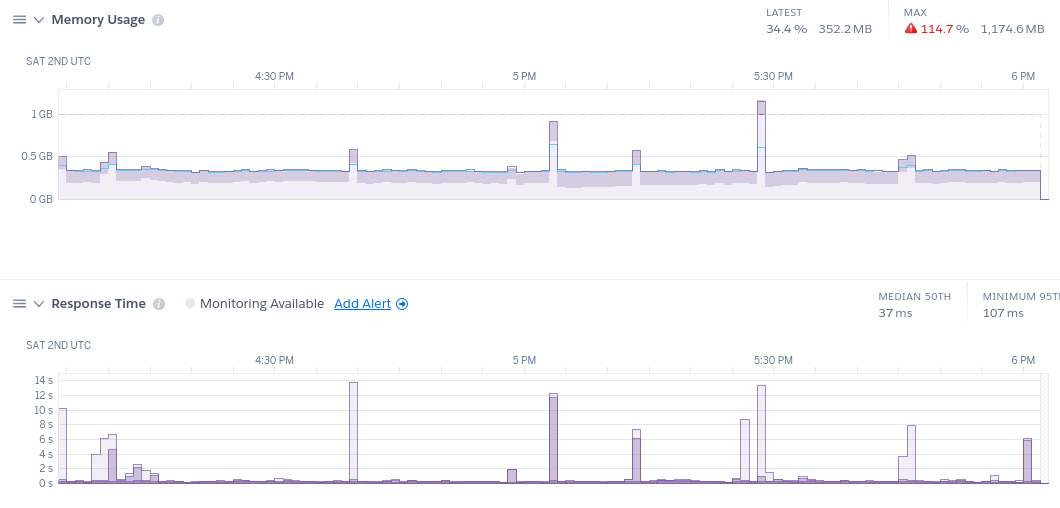
After trying some different things as make fields flatten instead of nesting (to use the above query). The time drop to ~ 15s, it's a lot (proportional), but still painful.
level_1 {
    property_1
    assoc_1_property_2
    assoc_1_property_3
}
I used exproof to profile it against an automated test (also tried eflame but didn't succeed) and try to find the root cause.
Those are the most expensive calls (complete output here).
... hundred of lines ...
erlang:send/2                                                                                     192     1.26    1531  [      7.97]
'Elixir.Ecto.Repo.Queryable':'struct_load!'/6                                                   11286     1.39    1694  [      0.15]
'Elixir.Jason.Encode':value/3                                                                    6796     1.39    1694  [      0.25]
'Elixir.Absinthe.Phase.Document.Execution.Resolution':reduce_resolution/1                        4014     1.51    1836  [      0.46]
'Elixir.Enum':'-map/2-lists^map/1-0-'/2                                                          8120     1.71    2081  [      0.26]
'Elixir.Ecto.Type':'of_base_type?'/2                                                             9287     2.18    2661  [      0.29]
'Elixir.Inspect.Algebra':format/3                                                               13341     2.34    2854  [      0.21]
'Elixir.Ecto.Type':adapter_load/3                                                               11037     2.54    3093  [      0.28]
crypto:mac_nif/4                                                                                 1001     2.59    3153  [      3.15]
erlang:spawn_link/3                                                                                38     3.30    4024  [    105.89]
'Elixir.Jason.Encode':escape_json_chunk/5                                                       52203     5.40    6583  [      0.13]
---------------------------------------------------------------------------------------------  ------  -------  ------  [----------]
Total:                                                                                         488649  100.00%  121802  [      0.25]
32m.0m

Finished in 4.2 seconds
The function which caught my attention was, 'Elixir.Jason.Encode':escape_json_chunk/5, cause it is expensive and it always increases with the number of fields returned. Looking into escape_json_chunck you can see it's recursive which makes sense to grow costs linearly with returned values. Unfurtanelly I didn't succeed to extract the memory footprint, but I believe both time and memory problems are related.
I've also tried other permutations, in general, nested fields take more time than flatten ones, it isn't clear for me why, but I've some examples, expect it helps you with a conclusion:
- Flatten call with 10k objects (total 1 fetched field) - 488649 calls.
- Nested call with 10k objects - total 2 fetched field (one 1st level, one 2nd level) - 10510520 calls.
- Flatten call with 10k objects and 1 extra attribute (total 2 fetched field, both 1st level) - 3342383 calls.
@benwilson512 you can reproduce the problem with this repo, to try different params to the query you can change the test cases.
Considering escaping should be performed in all chunks, can we bypass this problem? I can't see any reasonable solution (maybe make escaping optional, but it looks bug prune...), any thoughts about it @michalmuskala?
cc: @rhnonose
 pmargreff
on 2 Nov 2019
pmargreff
on 2 Nov 2019
There are two basic cases to look into in here - encoding keys and encoding values. If the issue is with encoding keys, then it should be possible to optimise it. If the issue is encoding values, then it will be much harder.
Looking at these logs, what is actually worrisome to me are all the inspect calls - inspect shouldn't be used for production things.
 michalmuskala
on 3 Nov 2019
michalmuskala
on 3 Nov 2019
@michalmuskala I think the inspect calls are run because the benchmarks are run in test env, which might also have other performance impact elsewhere.
jeroenvisser101
on 4 Nov 2019
Can you elaborate on the connection between the test env and inspect being called?
benwilson512
on 4 Nov 2019
@benwilson512 I was assuming that inspect was used in Logger calls that would be stripped at compilation when run in production, but when I looked into it further, it seems inspect calls in Absinthe are used for various stuff, not exclusive to errors/logger calls.
jeroenvisser101
on 5 Nov 2019
Absinthe has inspect implementations for certain Structs but only for
debugging. It should not be run during normal query resolution. Do you have
a sense of what is being inspected and where?
On Tue, Nov 5, 2019 at 3:18 AM Jeroen Visser notifications@github.com
wrote:
@benwilson512 https://github.com/benwilson512 I was assuming that
inspect was used in Logger calls that would be stripped at compilation when
run in production, but when I looked into it further, it seems inspect
calls in Absinthe are used for various stuff, not exclusive to
errors/logger calls.—
You are receiving this because you were mentioned.
Reply to this email directly, view it on GitHub
https://github.com/absinthe-graphql/absinthe/issues/573?email_source=notifications&email_token=AAB4QCP2HS5GNY76JGBZWCLQSFJALA5CNFSM4FIUZEZKYY3PNVWWK3TUL52HS4DFVREXG43VMVBW63LNMVXHJKTDN5WW2ZLOORPWSZGOEDCPWJA#issuecomment-549780260,
or unsubscribe
https://github.com/notifications/unsubscribe-auth/AAB4QCP547VJJCG62HHDZL3QSFJALANCNFSM4FIUZEZA
.
benwilson512
on 5 Nov 2019
@benwilson512 I did some further investigation, and found that the inspect calls are actually made from dataloader:
https://github.com/absinthe-graphql/dataloader/commit/ce9ac3f3e4649dd15a3094ad50ba841511455d31#diff-cb130db1770f44aedd393088b4d91bcdR252
It seems like some changes were made in the way errors are reported. Dataloader.Ecto seems to rely on errors to update pending batches, because it abuses fetch/3 to check if a value has previously been loaded. If we either added a argument to fetch/3 to toggle detailed errors, or to introduce fetched?/3 and used that in load/3, we would prevent inspect calls.
I also noticed that a lot of time is spend on some other calls (from 11k results):
'Elixir.Map':take/2    66001     2.43    85809  [      1.30]
'Elixir.Map':take/3   528008     2.65    93489  [      0.18]
Which seem to be because we're pulling some fields that are shared between Execution and Resolution:
common =
  Map.take(exec, [:adapter, :context, :acc, :root_value, :schema, :fragments, :fields_cache])
Are any of these keys shared across fields? It might be faster to add all those keys manually instead of using Map.take (and Map.merge).
jeroenvisser101
on 6 Nov 2019
Aha great catch! I will push a change to dataloader to eliminate the inspect as part of the ordinary flow.
As for the Map.take, Map.take + Map.merge are definitely the fastest way to get a set of keys / values from one map into another, we benchmarked it. Both are implemented as BIFs these days, so they'll win out every time over N get / put calls.
The time spent on Map.take is significantly because of how many times it has to do that. I can look and see if there is a way to cut that down.
benwilson512
on 6 Nov 2019
We've some fix in absinthe-graphql/dataloader#84, but also, room for improvement once Elixir.Absinthe.Phase.Document.Execution.Resolution takes a lot of time (from 15% to 20%). I've no context here, do you think it can be improved in any significant way?
pmargreff
on 30 Nov 2019
I am experiencing slow responses too with a very small application. It takes around 800ms to receive the result. DB queries are max 2ms. I am using the latest 1.5.0-rc.2 version. I really can't pinpoint to where my application code would take the performance hit, and unfortunately I don't know how to profile an elixir application. I see some screenshots above of profiler results, what tools were used to generate those reports?
 DragosMocrii
on 9 Jan 2020
DragosMocrii
on 9 Jan 2020
@DragosMocrii you can check the debug repo. I've used exprof, it's a wrapper for the native debug module, you can also use cprof, eprof or fprof directly.
pmargreff
on 9 Jan 2020
Thanks @pmargreff ! I started fiddling with fprof, but I'm still trying to understand how it works. I was hoping for an easier solution, such as an installable dependency that has a nice GUI, but I guess that's too much to ask :)
DragosMocrii
on 9 Jan 2020
@DragosMocrii You may want to update Dataloader as well, we just pushed a release containing that fixes an issue where values that were not found within dataloader would always get inspected, which can be quite slow.
benwilson512
on 9 Jan 2020
@benwilson512 thank you for the suggestion! I have found the source of my trouble, it was the call to Pbkdf2.verify_pass that would slow down the response. Turns out this is the proper way it works, in order to prevent timing attacks. Removing this call, Absinthe returns my response in ~15ms, which is sweet! Sorry for the trouble, Absinthe is amazing!
DragosMocrii
on 9 Jan 2020
@DragosMocrii ah yeah if the operation is a login operation, verifying the password will normally take a while and make the overall response long. Glad to hear you sorted it out!
benwilson512
on 9 Jan 2020
@benwilson512 about this comment
The time spent on Map.take is significant because of how many times it has to do that. I can look and see if there is a way to cut that down.
I'm optimizing another unrelated code and replacing Maps with :ets (at least on my use case it is 40% faster), do you think it can be useful in this situation? If you think it worth I can try submit a POC in future...
pmargreff
on 12 May 2020
Is there a reason this is closed? I haven't seen a clear cut answer and seems very related to some issues that I've seen as well and posted about on the Elixir Forum here: https://elixirforum.com/t/absinthe-graphql-performance-issues/31746/9.
I do agree with @pmargreff that the biggest bottleneck seems to be `Elixir.Absinthe.Phase.Document.Execution.Resolution'.
 derekbrown
on 28 May 2020
derekbrown
on 28 May 2020
@derekbrown Your investigation isn't related to the concrete issues raised here. In one case, there was an issue with dataloader that unnecessarily called inspect, that has been fixed. In another case, the resolution function was calling a bcrypt function which is intentionally slow.
The resolution phase will always be the slowest phase, it's the phase that runs your resolution functions. Using this issue to discuss all scenarios where Absinthe could be faster isn't a good use of issues.
benwilson512
on 28 May 2020
@benwilson512 No worries! Different repos use issues differently; just didn't see a comment as to why this in particular was closed, and saw relatively recent comments about resolution performance so thought it relevant. Thanks for clarifying!
derekbrown
on 28 May 2020
Related issues
 arathunku
·
4Comments
arathunku
·
4Comments
 Acidic9
·
3Comments
Acidic9
·
3Comments
 bruce
·
4Comments
bruce
·
4Comments
 maennchen
·
6Comments
maennchen
·
6Comments
 tlvenn
·
4Comments
tlvenn
·
4Comments
Most helpful comment
I'm stuck with the same problem. Yesterday I took some time to debug it.
First, both the apollo engine and Appsignal give me the same information, almost the same showed by @svileng in this comment. I'm using Dataloader, so it isn't an N+1 query problem.
We have a simple query with a lot of results (between 2k and 3k), the query is something very near people have pointed here.
This query is really slow ~ 21 seconds if I remove nested fields it goes to something between 7~10 seconds. Not the main point here, but we also have some weird memory peaks, those aren't frequent (neither is the problematic query). Our logging shows the peaks only appearing when this query with a lot of results is called.
After trying some different things as make fields flatten instead of nesting (to use the above query). The time drop to ~ 15s, it's a lot (proportional), but still painful.
I used exproof to profile it against an automated test (also tried eflame but didn't succeed) and try to find the root cause.
Those are the most expensive calls (complete output here).
The function which caught my attention was,
'Elixir.Jason.Encode':escape_json_chunk/5, cause it is expensive and it always increases with the number of fields returned. Looking intoescape_json_chunckyou can see it's recursive which makes sense to grow costs linearly with returned values. Unfurtanelly I didn't succeed to extract the memory footprint, but I believe both time and memory problems are related.I've also tried other permutations, in general, nested fields take more time than flatten ones, it isn't clear for me why, but I've some examples, expect it helps you with a conclusion:
@benwilson512 you can reproduce the problem with this repo, to try different params to the query you can change the test cases.
Considering escaping should be performed in all chunks, can we bypass this problem? I can't see any reasonable solution (maybe make escaping optional, but it looks bug prune...), any thoughts about it @michalmuskala?
cc: @rhnonose